HOT TOPICS LIST
- MACD
- Fibonacci
- RSI
- Gann
- ADXR
- Stochastics
- Volume
- Triangles
- Futures
- Cycles
- Volatility
- ZIGZAG
- MESA
- Retracement
- Aroon
INDICATORS LIST
LIST OF TOPICS
PRINT THIS ARTICLE
by David Penn
Breaking beneath the support of two trend channels, the euro enters a dangerous stage in its descent.
Position: N/A
David Penn
Technical Writer for Technical Analysis of STOCKS & COMMODITIES magazine, Working-Money.com, and Traders.com Advantage.
PRINT THIS ARTICLE
CHANNEL LINES
The Euro Channel
06/09/05 07:55:33 AMby David Penn
Breaking beneath the support of two trend channels, the euro enters a dangerous stage in its descent.
Position: N/A
| In a recent article for Traders.com Advantage ("QQQQ Channel Pairs," May 24, 2005) I talked about how the evolution of a trend can often be graphically represented by pairs of channel lines or trend channels. Trend channels, as I have written elsewhere, are a classic analytic method in technical analysis; Robert Edwards and John Magee talk about trend channels in their book, Technical Analysis Of Stock Trends, which was first published in 1948. Trend channels are also a part of Elliott wave analysis, which Ralph Nelson Elliott began describing as early as 1939. |
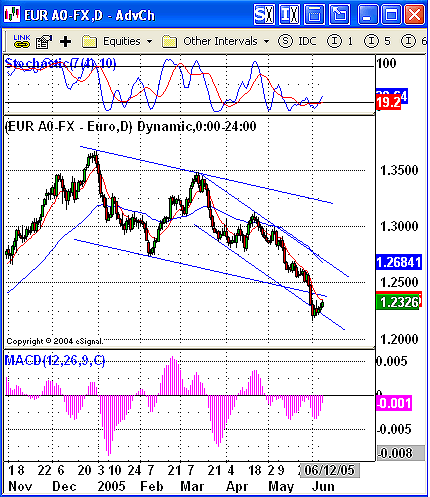
| While any given trend channel might be important, it is particularly interesting to note how trends react to their channels, reactions that often mean creating a secondary, newer, and more sharply inclined trend channel. In the instance of the QQQQ, in which the trend was upward, one trend channel begat another, steeper trend channel. Here, in the case of the EUR/USD, we have a downtrend channel beginning in December that, by the spring, has spawned a tighter channel that is steeper and more sharply inclined. |

|
| Figure 1: The wide trend channel that bounds the initial descent of EUR/USD appears ready to give way to a tighter, steeper channel over the course of the spring of 2005. |
| Graphic provided by: eSignal. |
| |
| My general impression from watching (and writing) about these trend channels in recent weeks and months is that the creation of the second, steeper channel tends to mark a turning point in the trend. Either prices will pursue the new, more aggressive and ambitious route higher or lower by way of the new trend channel, or prices will eventually react negatively to a more ambitious trend channel that, to the upside or the downside, demands more of the trend than the trend is capable of providing. In the case of the former--in which the new trend truly does represent the next trend--one common phenomenon is for prices to break out beyond the old channel, then find support or resistance (depending on whether the trend is up or down, respectively) on the back (again, or bottom) of the old channel. Using the EUR/USD as an example, we would look for prices to remain below the lower boundary of the old trend channel. |
| Failing this, there would still be a chance for further downside if EUR/USD remained within its new, tighter trend channel. In the case of the latter--in which the new trend represents an unsustainable extreme--we should expect prices not only to move back into the old trend channel (the lower boundary of which would not provide much in the way of resistance), but we should also expect prices to break out beyond the upper boundary of the new trend channel. |
| Of course, if the market were truly reversing, making the six-month correction from December to June nothing more than that, then the upper boundary of the old trend channel would have to be breached as well. But fortunately, a trader or speculator looking to exploit a reversal would likely not need to wait that long before EUR/USD would have provided abundant evidence of its intent to move higher instead of lower. |
Technical Writer for Technical Analysis of STOCKS & COMMODITIES magazine, Working-Money.com, and Traders.com Advantage.
| Title: | Technical Writer |
| Company: | Technical Analysis, Inc. |
| Address: | 4757 California Avenue SW |
| Seattle, WA 98116 | |
| Phone # for sales: | 206 938 0570 |
| Fax: | 206 938 1307 |
| Website: | www.Traders.com |
| E-mail address: | DPenn@traders.com |
Traders' Resource Links | |
| Charting the Stock Market: The Wyckoff Method -- Books | |
| Working-Money.com -- Online Trading Services | |
| Traders.com Advantage -- Online Trading Services | |
| Technical Analysis of Stocks & Commodities -- Publications and Newsletters | |
| Working Money, at Working-Money.com -- Publications and Newsletters | |
| Traders.com Advantage -- Publications and Newsletters | |
| Professional Traders Starter Kit -- Software | |
Click here for more information about our publications!
Comments
Date: 06/11/05Rank: 3Comment:

Request Information From Our Sponsors
- StockCharts.com, Inc.
- Candle Patterns
- Candlestick Charting Explained
- Intermarket Technical Analysis
- John Murphy on Chart Analysis
- John Murphy's Chart Pattern Recognition
- John Murphy's Market Message
- MurphyExplainsMarketAnalysis-Intermarket Analysis
- MurphyExplainsMarketAnalysis-Visual Analysis
- StockCharts.com
- Technical Analysis of the Financial Markets
- The Visual Investor
- VectorVest, Inc.
- Executive Premier Workshop
- One-Day Options Course
- OptionsPro
- Retirement Income Workshop
- Sure-Fire Trading Systems (VectorVest, Inc.)
- Trading as a Business Workshop
- VectorVest 7 EOD
- VectorVest 7 RealTime/IntraDay
- VectorVest AutoTester
- VectorVest Educational Services
- VectorVest OnLine
- VectorVest Options Analyzer
- VectorVest ProGraphics v6.0
- VectorVest ProTrader 7
- VectorVest RealTime Derby Tool
- VectorVest Simulator
- VectorVest Variator
- VectorVest Watchdog
