HOT TOPICS LIST
- MACD
- Fibonacci
- RSI
- Gann
- ADXR
- Stochastics
- Volume
- Triangles
- Futures
- Cycles
- Volatility
- ZIGZAG
- MESA
- Retracement
- Aroon
INDICATORS LIST
LIST OF TOPICS
PRINT THIS ARTICLE
by Jayanthi Gopalakrishnan
Reading the Level II screen is more an art than a science.
Position: N/A
Jayanthi Gopalakrishnan
PRINT THIS ARTICLE
Understanding Level II Quotes - Part 2
07/11/00 01:35:34 PMby Jayanthi Gopalakrishnan
Reading the Level II screen is more an art than a science.
Position: N/A
| A snapshot view of the Level II screen gives you a picture of the supply and demand of a stock. The forces of supply and demand cause price movement, or momentum, in a stock. Simply stated, when supply is greater than demand, prices fall. Conversely, when demand is greater than supply, prices rise. |
| If you are viewing Level II screens for the first time, you may find them overwhelming. If you get a chance, view the Level II screen of the most actively traded stock. Prices will be moving so rapidly that it may be difficult to unravel the information provided. However, if you are aspiring to be a day trader, don't be intimidated by the speed of the price movement; being able to decipher them will provide you with an in-depth understanding of the supply and demand forces responsible for moving a stock price. |

|
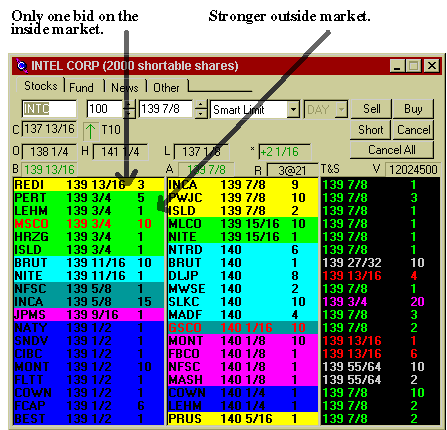
| Level II screens give you a feel for market maker activity, providing you with insight into the direction of price movement. |
| Graphic provided by: CyBerCorp, Inc.. |
| |
| In the previous article, I had mentioned that the quotes listed on the left-hand side were the bids and those on the right were offers. The highest bids and offers are listed first. These are known as the inside market. All those listed below the highest are called the outside market. The activity in the outside market gives you insight on the strength of the inside market. On the Level II screen displayed above, notice there is only one inside bid. However, the number of bids of the outside market are strong. This suggests that the demand for the stock is still strong and you can expect further upward movement. If, on the other hand, you notice that buying interest is fading in the outside market, it suggests that the demand for the stock is deteriorating and prices are likely to fall. |
| The right-hand side, which displays the offers, gives you an idea of the supply side. If you see the strength of the offers increasing in the outside market, it suggests that market makers are interested in selling their holdings. This means that you can expect prices to fall. If, however, the outside market displays few offers, you know that sooner or later the selling interest will deteriorate and you can expect prices to start moving up. |
| By viewing market maker activity of both the inside and outside markets you can get a feel for what the market makers are doing. This in turn presents you with a picture of the forces of supply and demand which gives you a deeper understanding of the strength or weakness of a specific stock. |
| Title: | Editor |
| Company: | Technical Analysis of Stocks & Commodities |
| Address: | 4757 California Ave SW |
| Seattle, WA 98116 | |
| Website: | Traders.com |
| E-mail address: | Jayanthi@traders.com |
Traders' Resource Links | |
| Charting the Stock Market: The Wyckoff Method -- Books | |
| Working-Money.com -- Online Trading Services | |
| Traders.com Advantage -- Online Trading Services | |
| Technical Analysis of Stocks & Commodities -- Publications and Newsletters | |
| Working Money, at Working-Money.com -- Publications and Newsletters | |
| Traders.com Advantage -- Publications and Newsletters | |
| Professional Traders Starter Kit -- Software | |
Click here for more information about our publications!
Comments
Date: / /Rank: 5Comment:

Request Information From Our Sponsors
- StockCharts.com, Inc.
- Candle Patterns
- Candlestick Charting Explained
- Intermarket Technical Analysis
- John Murphy on Chart Analysis
- John Murphy's Chart Pattern Recognition
- John Murphy's Market Message
- MurphyExplainsMarketAnalysis-Intermarket Analysis
- MurphyExplainsMarketAnalysis-Visual Analysis
- StockCharts.com
- Technical Analysis of the Financial Markets
- The Visual Investor
- VectorVest, Inc.
- Executive Premier Workshop
- One-Day Options Course
- OptionsPro
- Retirement Income Workshop
- Sure-Fire Trading Systems (VectorVest, Inc.)
- Trading as a Business Workshop
- VectorVest 7 EOD
- VectorVest 7 RealTime/IntraDay
- VectorVest AutoTester
- VectorVest Educational Services
- VectorVest OnLine
- VectorVest Options Analyzer
- VectorVest ProGraphics v6.0
- VectorVest ProTrader 7
- VectorVest RealTime Derby Tool
- VectorVest Simulator
- VectorVest Variator
- VectorVest Watchdog
