

HOT TOPICS LIST
- MACD
- Fibonacci
- RSI
- Gann
- ADXR
- Stochastics
- Volume
- Triangles
- Futures
- Cycles
- Volatility
- ZIGZAG
- MESA
- Retracement
- Aroon
INDICATORS LIST
LIST OF TOPICS
PRINT THIS ARTICLE
by David Penn
What a shooting star took away from the 10-year Treasury note yield, a hammer threatens to bring back.
Position: N/A
David Penn
Technical Writer for Technical Analysis of STOCKS & COMMODITIES magazine, Working-Money.com, and Traders.com Advantage.
PRINT THIS ARTICLE
CANDLESTICK CHARTING
Hammering Out A Bear Market Bottom
06/08/05 07:48:38 AMby David Penn
What a shooting star took away from the 10-year Treasury note yield, a hammer threatens to bring back.
Position: N/A
| While there's a lot of talk about why engineers and other mathematically inclined folks find themselves falling in love with technical analysis, those of us who hail from the other end of the campus can point to a certain poetry, an art in the patterns of advancing and declining prices, in consolidations and trading ranges. |
| In this, technical analysis is a lot about what you bring to it as an analytical person: Whether you are a numbers person or a pictures person, technical analysis will likely be equally helpful when attempting to anticipate or respond to price action in the marketplace. |
|
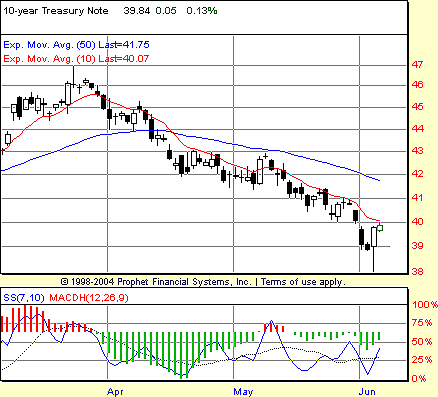
| Figure 1: The hammer candlestick in early June appears with a positive stochastic divergence between the mid-April and June lows. |
| Graphic provided by: Prophet Financial, Inc. |
| |
| Perhaps nowhere else is the poetry of technical analysis more apparent than in Japanese candlestick analysis. And by this, I don't mean merely the colorfully interpretive names like "bearish engulfing" or "three white soldiers." What makes the poetry of Japanese candlestick analysis so effective for the mind as well as pleasing to the ear is that the patterns are so evocative, so telling. So much so, in fact, that traders like Oliver Velez Jr. of Pristine.com has said more than once that he will not even bother to look at a chart unless it is in Japanese candlestick form. |
| The recent decline in the $TNX, or yield on the 10-year Treasury note, has accompanied what is so far a bear market rally in stocks. As stocks bottomed in late March, the yield on the 10-year note formed a shooting star--a bearish Japanese candlestick pattern that anticipates a reversal to the downside. Writing about shooting stars, Steve Nison in his book, Japanese Candlestick Charting Techniques, notes that "the shooting star pictorially tells us that the market opened near its low, then strongly rallied and finally backed off to close near the opening. In other words, that session's rally could not be sustained." |
| A little over two months later, the decline in the $TNX has produced a hammer in mid-June (Figure 1). In many ways, the hammer is the opposite of a shooting star candlestick. While a shooting star arrives at the end of an extended uptrend, a hammer arrives at the end of an extended downtrend. Nevertheless, the appearance of either is often a strong message that the market is overextended in its current direction and a reversal of some magnitude quite likely. What this means for those longing for ever-lower long rates remains to be seen (look for my Working Money article, "Bond. Long Bond" for more analysis on the bond market). But for now, the hammer in mid-June is warning yield bears that the best days of long-dated rate declines may have come to an end. |
Technical Writer for Technical Analysis of STOCKS & COMMODITIES magazine, Working-Money.com, and Traders.com Advantage.
| Title: | Technical Writer |
| Company: | Technical Analysis, Inc. |
| Address: | 4757 California Avenue SW |
| Seattle, WA 98116 | |
| Phone # for sales: | 206 938 0570 |
| Fax: | 206 938 1307 |
| Website: | www.Traders.com |
| E-mail address: | DPenn@traders.com |
Traders' Resource Links | |
| Charting the Stock Market: The Wyckoff Method -- Books | |
| Working-Money.com -- Online Trading Services | |
| Traders.com Advantage -- Online Trading Services | |
| Technical Analysis of Stocks & Commodities -- Publications and Newsletters | |
| Working Money, at Working-Money.com -- Publications and Newsletters | |
| Traders.com Advantage -- Publications and Newsletters | |
| Professional Traders Starter Kit -- Software | |
Click here for more information about our publications!
Comments
Date:�06/08/05Rank:�4Comment:�
Date:�06/09/05Rank:�5Comment:�

Request Information From Our Sponsors
- VectorVest, Inc.
- Executive Premier Workshop
- One-Day Options Course
- OptionsPro
- Retirement Income Workshop
- Sure-Fire Trading Systems (VectorVest, Inc.)
- Trading as a Business Workshop
- VectorVest 7 EOD
- VectorVest 7 RealTime/IntraDay
- VectorVest AutoTester
- VectorVest Educational Services
- VectorVest OnLine
- VectorVest Options Analyzer
- VectorVest ProGraphics v6.0
- VectorVest ProTrader 7
- VectorVest RealTime Derby Tool
- VectorVest Simulator
- VectorVest Variator
- VectorVest Watchdog
- StockCharts.com, Inc.
- Candle Patterns
- Candlestick Charting Explained
- Intermarket Technical Analysis
- John Murphy on Chart Analysis
- John Murphy's Chart Pattern Recognition
- John Murphy's Market Message
- MurphyExplainsMarketAnalysis-Intermarket Analysis
- MurphyExplainsMarketAnalysis-Visual Analysis
- StockCharts.com
- Technical Analysis of the Financial Markets
- The Visual Investor