HOT TOPICS LIST
- MACD
- Fibonacci
- RSI
- Gann
- ADXR
- Stochastics
- Volume
- Triangles
- Futures
- Cycles
- Volatility
- ZIGZAG
- MESA
- Retracement
- Aroon
INDICATORS LIST
LIST OF TOPICS
PRINT THIS ARTICLE
by David Penn
A positive stochastic divergence sends sugar futures higher.
Position: N/A
David Penn
Technical Writer for Technical Analysis of STOCKS & COMMODITIES magazine, Working-Money.com, and Traders.com Advantage.
PRINT THIS ARTICLE
REVERSAL
Sweet Divergences
06/07/05 09:42:25 AMby David Penn
A positive stochastic divergence sends sugar futures higher.
Position: N/A
| For me, one of the most ironic situations in commodity price history is the fact that in 1974, at the very bottom of the secular bear market in stocks from 1966 to 1982, the price of sugar was going through the roof. In November 1974, the price of sugar (basis continuous futures) soared to more than 60 cents a pound! |
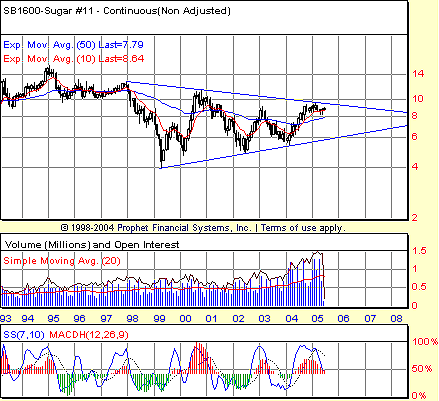
| Such lofty prices for the sweet stuff are truly a thing of the past. Sugar prices have been in a bear market ever since inflation was finally whipped in the early 1980s. In particular, the last seven years has seen sugar slip into a symmetrical triangle which, while no less bearish, does portend significant price volatility once the pattern is complete. See Figure 1. |

|
| Figure 1: This contracting triangle, which has been developing since the late 1990s, suggests the possibility of a strong secular move in sugar prices. |
| Graphic provided by: Prophet Financial, Inc. |
| |
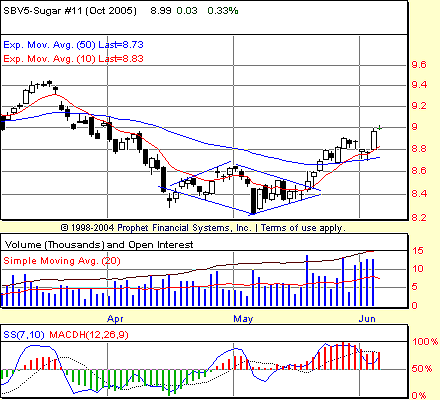
| This long-term contracting triangle provides an interesting context for the current advance in sugar. On a far more mortal time frame, sugar appears to have made a significant low just north of 8.2 cents in early May 2005. The significance of that low is betrayed in part by the running positive stochastic divergences between the March and April lows, and again between the April and May lows. This sort of divergence suggested that momentum was running out on the downside, and that a reaction back up--for example, into the 50-day exponential moving average (EMA)--increasingly likely. This, as Figure 2 shows, is precisely what happened as a short-term base was formed over the first half of May, with a breakout from that base taking place over the balance of the month. This is also an opportunity to see the convergence of chart patterns and indicators. Note how the consolidation between mid-April and mid-May took the form of a diamond. Diamond patterns are notoriously nondirectional. So any clues a speculator might spot that can tip the odds toward an upside or a downside break would be valuable indeed. Fortunately, the positive stochastic divergence that appears within the diamond pattern was a sound clue that upside was more likely than downside. Given the size of the diamond (approximately 0.4 of a cent), and a breakout just north of 8.4 cents, traders could have expected a relatively straightforward ride to the 8.8 area before any meaningful pullback or lower low occurred. |

|
| Figure 2: The upside breakout from this diamond consolidation pattern was anticipated by the positive stochastic divergences between the April and May lows. |
| Graphic provided by: Prophet Financial, Inc. |
| |
| There is another technical point worth mentioning here. Note that once prices climbed above potential resistance at the 10- and 50-day EMAs, they pulled back to find support on the back of those same moving averages. As they were doing this pullback, note how the MACD histogram in red grew lower, then reversed and began increasing. This is one of the ways that the MACD histogram--or MACDH--can help traders and speculators spot shifts in momentum that can mean the resumption of a trend. |
| Note also that while this pullback is occurring and the MACDH is getting lower, prices themselves are forming a telltale, bullish flag. Over the span of about four or five days late in May and early in June, October sugar prices slid gently lower in a brief channel before breaking out in strong fashion, vaulting above the previous month's high toward the nine-cent mark. And if the measurement rule for the bullish flag works as well as did the measurement rule for the diamond consolidation--a measurement rule that per Thomas Bulkowski's Encyclopedia Of Chart Patterns calls for adding the length of the trend previous to the flag to the value at the low point of the flag--look for sugar to test the nine-and-a-quarter mark before its run is done. |
Technical Writer for Technical Analysis of STOCKS & COMMODITIES magazine, Working-Money.com, and Traders.com Advantage.
| Title: | Technical Writer |
| Company: | Technical Analysis, Inc. |
| Address: | 4757 California Avenue SW |
| Seattle, WA 98116 | |
| Phone # for sales: | 206 938 0570 |
| Fax: | 206 938 1307 |
| Website: | www.Traders.com |
| E-mail address: | DPenn@traders.com |
Traders' Resource Links | |
| Charting the Stock Market: The Wyckoff Method -- Books | |
| Working-Money.com -- Online Trading Services | |
| Traders.com Advantage -- Online Trading Services | |
| Technical Analysis of Stocks & Commodities -- Publications and Newsletters | |
| Working Money, at Working-Money.com -- Publications and Newsletters | |
| Traders.com Advantage -- Publications and Newsletters | |
| Professional Traders Starter Kit -- Software | |
Click here for more information about our publications!
Comments
Date: 06/07/05Rank: 3Comment:

Request Information From Our Sponsors
- StockCharts.com, Inc.
- Candle Patterns
- Candlestick Charting Explained
- Intermarket Technical Analysis
- John Murphy on Chart Analysis
- John Murphy's Chart Pattern Recognition
- John Murphy's Market Message
- MurphyExplainsMarketAnalysis-Intermarket Analysis
- MurphyExplainsMarketAnalysis-Visual Analysis
- StockCharts.com
- Technical Analysis of the Financial Markets
- The Visual Investor
- VectorVest, Inc.
- Executive Premier Workshop
- One-Day Options Course
- OptionsPro
- Retirement Income Workshop
- Sure-Fire Trading Systems (VectorVest, Inc.)
- Trading as a Business Workshop
- VectorVest 7 EOD
- VectorVest 7 RealTime/IntraDay
- VectorVest AutoTester
- VectorVest Educational Services
- VectorVest OnLine
- VectorVest Options Analyzer
- VectorVest ProGraphics v6.0
- VectorVest ProTrader 7
- VectorVest RealTime Derby Tool
- VectorVest Simulator
- VectorVest Variator
- VectorVest Watchdog
