HOT TOPICS LIST
- MACD
- Fibonacci
- RSI
- Gann
- ADXR
- Stochastics
- Volume
- Triangles
- Futures
- Cycles
- Volatility
- ZIGZAG
- MESA
- Retracement
- Aroon
INDICATORS LIST
LIST OF TOPICS
PRINT THIS ARTICLE
by Koos van der Merwe
"Canadian bonds typically follow the US market, and this week was no exception as the price of both rose," Canada's National Post said on Friday, June 3. ...
Position: Sell
Koos van der Merwe
Has been a technical analyst since 1969, and has worked as a futures and options trader with First Financial Futures in Johannesburg, South Africa.
PRINT THIS ARTICLE
ELLIOTT WAVE
A Demise In The Dow?
06/07/05 12:38:54 PMby Koos van der Merwe
"Canadian bonds typically follow the US market, and this week was no exception as the price of both rose," Canada's National Post said on Friday, June 3. ...
Position: Sell
| "A disappointing job report yesterday contributed to expectations that the US economy may be slowing. High oil prices appear to be reducing consumer spending. This has some economists speculating that the US Federal Reserve may be close to ending its streak of short-term interest rate hikes," the Post added. |
| Both reports are negative for the economies of both the United States and Canada. Interest rates usually rise to slow down a growing economy. With bond prices rising, the market is effectively saying that there will be no further rate hikes, which translates into a weaker economy. |

|
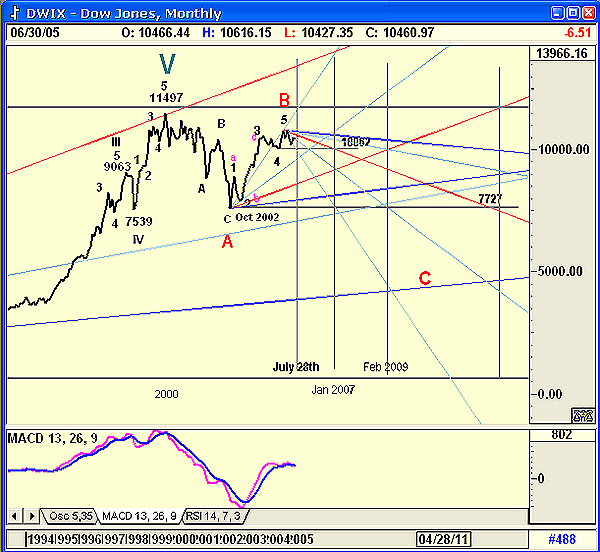
| Figure 1: Dow Jones monthly chart |
| Graphic provided by: AdvancedGET. |
| |
| Figure 1, my chart of the week, is therefore one that appears regularly on the website. This time, I have made it of the Dow Jones Industrial Average, and the dates, when compared to the one on the S&P on the site, are different. However, do note that the dates are a guide only, and can be out of sync by many months. |

|
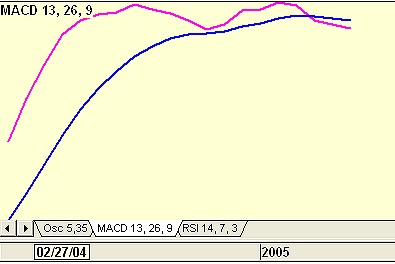
| Figure 2: Blowup of MACD crossing |
| Graphic provided by: AdvancedGET. |
| |
| What is important is the moving average convergence/divergence (MACD) indicator. Where the pink line has crossed below the blue line, a very definite and confirmed sell signal. Figure 2 is an enlargement of that cross. |

|
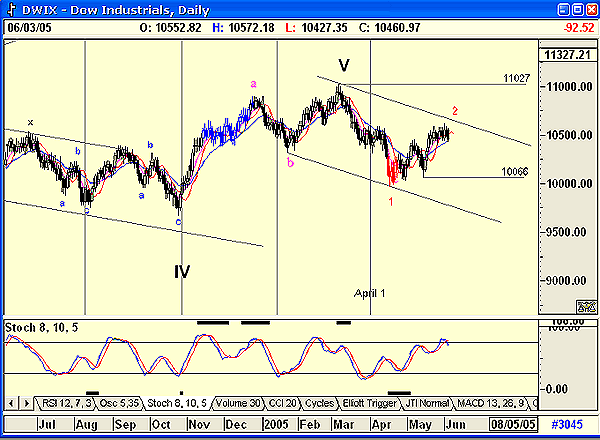
| Figure 3: Dow daily chart showing possible end of wave 2 |
| Graphic provided by: AdvancedGET. |
| |
| This means that we can now start expecting the DJIA to weaken--not a collapse as most could expect, but a gradual weakening leading to a major recession in the US, affecting world markets, and Canada. Figure 3 is a daily chart of the DJIA giving my expected wave count. The daily chart shows that a wave 2 up is almost complete, by probably testing the upper trendline. The stochastic indicator is overbought, but has not given a sell signal. It does show the uncertainty that is present in the market, and for that matter the world, at the moment. Of course, any break above the upper resistance line at 2 could see the DJIA rise to test 11027. On the other hand (note that President Harry S Truman remarked that he had yet to meet a one-handed economist), should the DJIA fall and break below the 10066 level, then we can see that the wave count as shown is correct, with the count as shown in Figure 1, also correct. Very nervous times ahead indeed. With June quarterly reports starting to come out, we may find many company results not up to expectations. |
Has been a technical analyst since 1969, and has worked as a futures and options trader with First Financial Futures in Johannesburg, South Africa.
| Address: | 3256 West 24th Ave |
| Vancouver, BC | |
| Phone # for sales: | 6042634214 |
| E-mail address: | petroosp@gmail.com |
Click here for more information about our publications!
Comments
Date: 06/07/05Rank: 3Comment:

Request Information From Our Sponsors
- StockCharts.com, Inc.
- Candle Patterns
- Candlestick Charting Explained
- Intermarket Technical Analysis
- John Murphy on Chart Analysis
- John Murphy's Chart Pattern Recognition
- John Murphy's Market Message
- MurphyExplainsMarketAnalysis-Intermarket Analysis
- MurphyExplainsMarketAnalysis-Visual Analysis
- StockCharts.com
- Technical Analysis of the Financial Markets
- The Visual Investor
- VectorVest, Inc.
- Executive Premier Workshop
- One-Day Options Course
- OptionsPro
- Retirement Income Workshop
- Sure-Fire Trading Systems (VectorVest, Inc.)
- Trading as a Business Workshop
- VectorVest 7 EOD
- VectorVest 7 RealTime/IntraDay
- VectorVest AutoTester
- VectorVest Educational Services
- VectorVest OnLine
- VectorVest Options Analyzer
- VectorVest ProGraphics v6.0
- VectorVest ProTrader 7
- VectorVest RealTime Derby Tool
- VectorVest Simulator
- VectorVest Variator
- VectorVest Watchdog
