HOT TOPICS LIST
- MACD
- Fibonacci
- RSI
- Gann
- ADXR
- Stochastics
- Volume
- Triangles
- Futures
- Cycles
- Volatility
- ZIGZAG
- MESA
- Retracement
- Aroon
INDICATORS LIST
LIST OF TOPICS
PRINT THIS ARTICLE
by Arthur Hill
The recent recovery in the Dow Industrials is quite impressive, but this key market barometer is not out of the woods just yet.
Position: Hold
Arthur Hill
Arthur Hill is currently editor of TDTrader.com, a website specializing in trading strategies, sector/industry specific breadth stats and overall technical analysis. He passed the Society of Technical Analysts (STA London) diploma exam with distinction is a Certified Financial Technician (CFTe). Prior to TD Trader, he was the Chief Technical Analyst for Stockcharts.com and the main contributor to the ChartSchool.
PRINT THIS ARTICLE
RETRACEMENT
Dow Reaches Its Moment Of Truth
06/07/05 08:25:38 AMby Arthur Hill
The recent recovery in the Dow Industrials is quite impressive, but this key market barometer is not out of the woods just yet.
Position: Hold
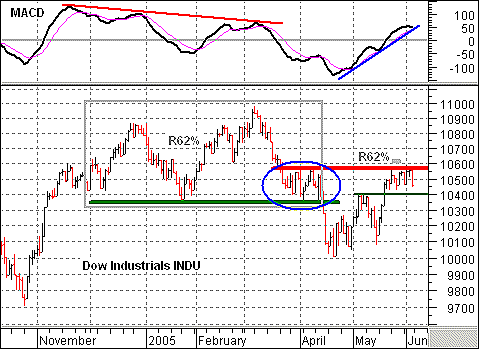
| On the daily chart (Figure 1), the Dow Jones Industrial Average (DJIA) broke a key support level in April and the recent recovery carried the average back above broken support. The pattern from October to March looks like a double top (see the gray box) and the move below the January low is bearish. You can also see that a large negative divergence in the moving average convergence/divergence (MACD) coincided with the double top. |

|
| Figure 1: DJIA |
| Graphic provided by: MetaStock. |
| Graphic provided by: Reuters Data. |
| |
| Is the current advance back above the support break a mere corrective rally, or was this rally strong enough to negate the double top? Thus far, evidence points to a corrective rally. First, the advance retraced 50-62% of the prior decline. This is normal for a corrective move. Second, there is a resistance zone around 10500 and the average stalled the last three weeks. Even though the average moved back above broken support, the March-April consolidation shows resistance around 10500 (blue oval). |
| The key lies with the current consolidation. After a sharp advance back above 10400, the average consolidated between 10600 and 10400 in the last three weeks. A move above 10600 would signal a continuation of the prior advance and argue for a move toward 11000. However, a failure below 10600 and move below 10400 would argue for a continuation of the prior decline. The downside target would be the October low around 9700. |
Arthur Hill is currently editor of TDTrader.com, a website specializing in trading strategies, sector/industry specific breadth stats and overall technical analysis. He passed the Society of Technical Analysts (STA London) diploma exam with distinction is a Certified Financial Technician (CFTe). Prior to TD Trader, he was the Chief Technical Analyst for Stockcharts.com and the main contributor to the ChartSchool.
| Title: | Editor |
| Company: | TDTrader.com |
| Address: | Willem Geetsstraat 17 |
| Mechelen, B2800 | |
| Phone # for sales: | 3215345465 |
| Website: | www.tdtrader.com |
| E-mail address: | arthurh@tdtrader.com |
Traders' Resource Links | |
| TDTrader.com has not added any product or service information to TRADERS' RESOURCE. | |
Click here for more information about our publications!
Comments
Date: 06/07/05Rank: 5Comment:
Date: 06/08/05Rank: 5Comment:
Date: 06/23/05Rank: 5Comment:

Request Information From Our Sponsors
- StockCharts.com, Inc.
- Candle Patterns
- Candlestick Charting Explained
- Intermarket Technical Analysis
- John Murphy on Chart Analysis
- John Murphy's Chart Pattern Recognition
- John Murphy's Market Message
- MurphyExplainsMarketAnalysis-Intermarket Analysis
- MurphyExplainsMarketAnalysis-Visual Analysis
- StockCharts.com
- Technical Analysis of the Financial Markets
- The Visual Investor
- VectorVest, Inc.
- Executive Premier Workshop
- One-Day Options Course
- OptionsPro
- Retirement Income Workshop
- Sure-Fire Trading Systems (VectorVest, Inc.)
- Trading as a Business Workshop
- VectorVest 7 EOD
- VectorVest 7 RealTime/IntraDay
- VectorVest AutoTester
- VectorVest Educational Services
- VectorVest OnLine
- VectorVest Options Analyzer
- VectorVest ProGraphics v6.0
- VectorVest ProTrader 7
- VectorVest RealTime Derby Tool
- VectorVest Simulator
- VectorVest Variator
- VectorVest Watchdog
