HOT TOPICS LIST
- MACD
- Fibonacci
- RSI
- Gann
- ADXR
- Stochastics
- Volume
- Triangles
- Futures
- Cycles
- Volatility
- ZIGZAG
- MESA
- Retracement
- Aroon
INDICATORS LIST
LIST OF TOPICS
PRINT THIS ARTICLE
by Paolo Pezzutti
The 30-year interest rate of this futures contract is at its all-time highs.
Position: N/A
Paolo Pezzutti
Author of the book "Trading the US Markets - A Comprehensive Guide to US Markets for International Traders and Investors" - Harriman House (July 2008)
PRINT THIS ARTICLE
TECHNICAL ANALYSIS
US T-Bond: Is It Time To Be Contrarian?
06/07/05 08:17:50 AMby Paolo Pezzutti
The 30-year interest rate of this futures contract is at its all-time highs.
Position: N/A
| On February 15, Federal Reserve chairman Alan Greenspan expressed his concerns about a 4.1% yield of the 10-year Treasury bond. On June 3, it went down farther, to 3.84% during the trading day. According to the news media, US economic models would provide for a 4.5%-5% yield. The "difficult" situation of the US economy is slowing down the expectations for a rise in interest rates to be operated by the Fed. However, the domestic gross product is expected to grow 3.5%, with inflation at 3%--not too bad after all. In addition, the two-year T-bond prints a 3.57% yield, only 41 points lower than the 10-year bond. In Europe, the Bund yield is at its lows at 3.23%, but the economic situation there is much more difficult. Can we expect to see short-term rates higher than long-term ones? Yes, if the scenario would be that of a recession. Rates on 30-year mortgages fell this week, hitting the lowest level in four months, according to an industry report. Mortgage giant Freddie Mac said Thursday, June 2, that its weekly nationwide survey showed that rates on 30-year, fixed-rate mortgages declined to 5.62%. The decline in mortgage rates over the past two months has helped spur sales of both new and existing homes to record levels in April, and analysts predicted further strong sales in May, based on further declines in rates. Some believe it is a speculative bubble. |
| Let's see the situation from a technical perspective. In the figures, you can see that I have used a stochastic indicator. The stochastic oscillators indicate overbought and oversold areas in the market, based upon momentum or price velocity. You can use different smoothing, according to the objective of your analysis. I have used a slow stochastic, providing a good setting for medium-term outlooks. |

|
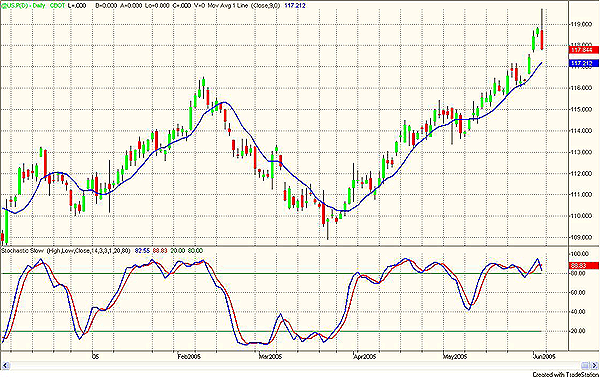
| Figure 1: Daily chart. A wide range reversal bar during the last trading session is a top indication. |
| Graphic provided by: TradeStation. |
| |
In Figure 1, the daily chart of the 30-year US Treasury bonds continuous contract went over 119 last Friday (June 3), its all-time high, and then closes down for the day below 118. It printed a reversal bar. In the short term it indicates, at least, a stop in the advance of prices. It was a wide-range directional bar that came out after a sort of spike, which explored a new ceiling for prices. It was clear during the day that the market was not able to sustain those levels and prices went down fast. This is the first sign of reversal. So far, the trend has been quite steady. The stochastic is still overbought, but it crossed its moving average, indicating the possibility of a correction. Some considerations:
|

|
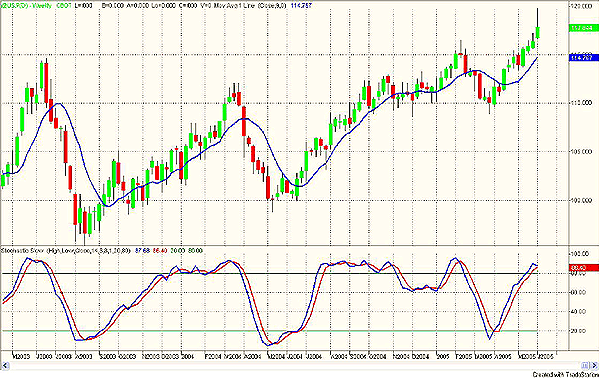
| Figure 2: The weekly chart. The Treasury bond gave a buy opportunity in March 2005 and now the trend is still steadily up. |
| Graphic provided by: TradeStation. |
| |
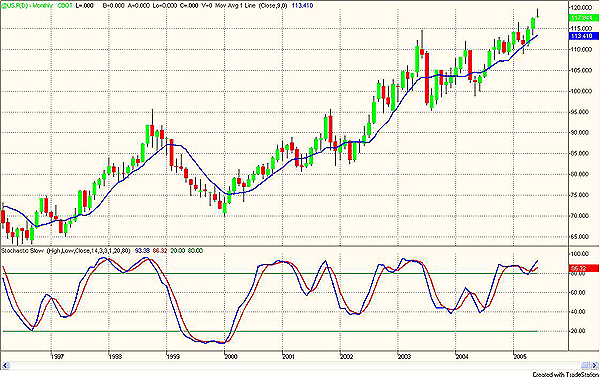
| In Figure 2, the weekly chart shows a still very healthy uptrend with the stochastic in overbought, as it normally is in stable and directional trends. In Figure 3, the monthly chart prints a similar situation. There was a bullish triangle formation developed between 2003 and 2004, broken to the upside at the beginning of 2005, giving new strength to the trend. The stochastic confirms the uptrend. |

|
| Figure 3: Monthly chart. The Treasury bond, after a consolidation between 2003 and 2004, moved to new highs. |
| Graphic provided by: TradeStation. |
| |
| So why should the trend finish right now? We cannot predict future price movements, but the risk/reward ratio based with the assumption of a decline or a stop in the advance of T-bond prices is interesting. On the daily chart, we have a promising formation that must be observed in the next days and weeks to find confirming elements. There is a limited upside potential at this point. The catalyst comes from a fundamental situation that does not provide much additional margin for further declines in long-term interest rates. Unless we believe a recession or a significant slowdown of the economy is ahead, which is possible, depending especially on the evolution of the Asian market (as in a China "bubble"), but difficult to predict at the moment. |
Author of the book "Trading the US Markets - A Comprehensive Guide to US Markets for International Traders and Investors" - Harriman House (July 2008)
| Address: | VIA ROBERTO AGO 26 POSTAL CODE 00166 |
| Rome, ITALY | |
| Phone # for sales: | +393357540708 |
| E-mail address: | pezzutti.paolo@tiscali.it |
Click here for more information about our publications!
Comments
Date: 06/07/05Rank: 4Comment:
Date: 06/08/05Rank: 3Comment:

|

Request Information From Our Sponsors
- StockCharts.com, Inc.
- Candle Patterns
- Candlestick Charting Explained
- Intermarket Technical Analysis
- John Murphy on Chart Analysis
- John Murphy's Chart Pattern Recognition
- John Murphy's Market Message
- MurphyExplainsMarketAnalysis-Intermarket Analysis
- MurphyExplainsMarketAnalysis-Visual Analysis
- StockCharts.com
- Technical Analysis of the Financial Markets
- The Visual Investor
- VectorVest, Inc.
- Executive Premier Workshop
- One-Day Options Course
- OptionsPro
- Retirement Income Workshop
- Sure-Fire Trading Systems (VectorVest, Inc.)
- Trading as a Business Workshop
- VectorVest 7 EOD
- VectorVest 7 RealTime/IntraDay
- VectorVest AutoTester
- VectorVest Educational Services
- VectorVest OnLine
- VectorVest Options Analyzer
- VectorVest ProGraphics v6.0
- VectorVest ProTrader 7
- VectorVest RealTime Derby Tool
- VectorVest Simulator
- VectorVest Variator
- VectorVest Watchdog
