HOT TOPICS LIST
- MACD
- Fibonacci
- RSI
- Gann
- ADXR
- Stochastics
- Volume
- Triangles
- Futures
- Cycles
- Volatility
- ZIGZAG
- MESA
- Retracement
- Aroon
INDICATORS LIST
LIST OF TOPICS
PRINT THIS ARTICLE
by Ashwani Gujral
Aladdin Knowledge Systems Ltd. appears to have completed a long consolidation and now has broken out of a seven-month trendline for another move up.
Position: Buy
Ashwani Gujral
He is founder of AGIP Securities Pvt. Ltd. which offers money management services, live chat rooms (during market hours) and independent technical analysis consultancy. The company has a big media presence from the likes of CNBC, NDTV Profit, and ZEE Business.
PRINT THIS ARTICLE
ADXR
Aladdin Knowledge Breaks Out
06/06/05 09:29:14 AMby Ashwani Gujral
Aladdin Knowledge Systems Ltd. appears to have completed a long consolidation and now has broken out of a seven-month trendline for another move up.
Position: Buy
| Healthy up- or downtrends are marked at regular intervals by consolidations and corrections. An uptrend or downtrend without any kind of pause, consolidation, or correction should be looked upon with suspicion. Consolidation allows some of the weaker hands to book profits and new, stronger hands to get an entry in to the stock. In addition, a concept called the ABC move is something all traders should be familiar with. All moves in stocks and indexes can be categorized as a move A in one direction, a reaction called B, and a resumption of the move A called move C. This concept allows the trader to act after the market or stock has shown its intentions. As always, trading is not about prediction, but money management. Technical analysis improves the odds of a trade succeeding, which should be enough for most competent traders. |

|
| Figure 1: Aladdin Knowledge daily chart |
| Graphic provided by: eSignal. |
| |
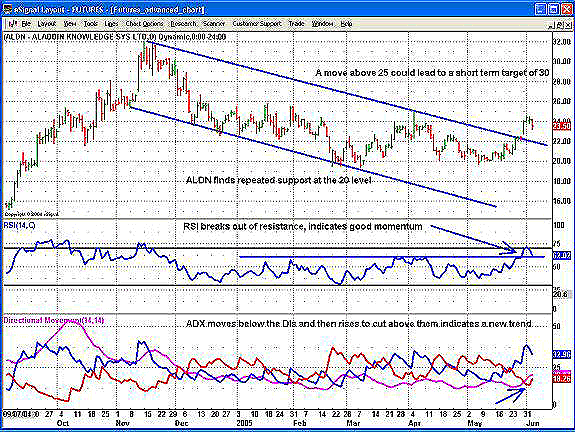
| On the daily chart (Figure 1), we can see a downward sloping channel, where the most recent low only reaches halfway in the channel before turning back and going through the upper boundary of the channel. This hints at the probability of the stock breaking on the upside from the channel. A short-term target can be calculated from the double-bottom pattern formed as ALDN takes support several times at 20. The neckline of this double bottom is at 25, and thus, a move above 25 leads to an approx target of 30. A third confirmation comes from the average directional movement index (ADX) as the ADX after moving below the DI lines crosses over the lower line, indicating a new trend and the end of a consolidation. |

|
| Figure 2: Aladdin Knowledge weekly chart |
| Graphic provided by: eSignal. |
| |
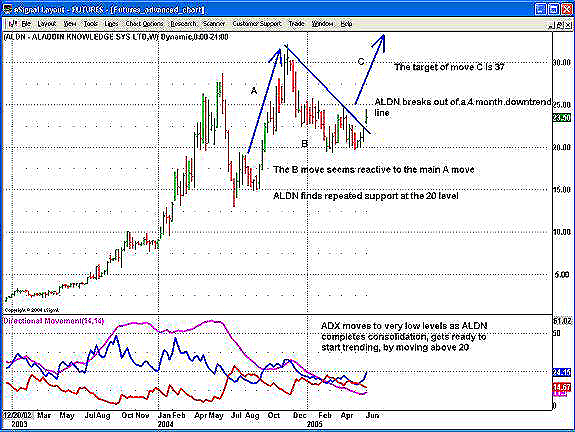
| On the weekly chart (Figure 2), the stock exhibits a move A on the upside, and a reaction B on the downside ending above the beginning of move A, finding strong support at the 20 level. An approximate target can also be ascertained from the ABC concept; the move A starts from 15 to 32 equals 17, by adding 17 to where the reaction ends -- that is, the 20 level -- a medium-term target of 37 is achieved. The second-month trendline signals gives the first weekly buy, hence confirming the daily signals. The ADX declines to extremely low levels and now turns up to cross over the DI from below, indicating the start of a new trend. Hence, it is likely that the trendline breakout, combined with a rising ADX, would lead to higher levels in the coming months. |
He is founder of AGIP Securities Pvt. Ltd. which offers money management services, live chat rooms (during market hours) and independent technical analysis consultancy. The company has a big media presence from the likes of CNBC, NDTV Profit, and ZEE Business.
| Title: | Chief mkt strategist |
| Company: | AGIP Securities |
| India | |
| Phone # for sales: | 9871066337 |
| Website: | www.ashwanigujral.com |
| E-mail address: | contact@ashwanigujral.com |
Traders' Resource Links | |
| AGIP Securities has not added any product or service information to TRADERS' RESOURCE. | |
Click here for more information about our publications!
Comments
Date: 06/06/05Rank: 5Comment:
Date: 04/16/06Rank: 5Comment:

Request Information From Our Sponsors
- VectorVest, Inc.
- Executive Premier Workshop
- One-Day Options Course
- OptionsPro
- Retirement Income Workshop
- Sure-Fire Trading Systems (VectorVest, Inc.)
- Trading as a Business Workshop
- VectorVest 7 EOD
- VectorVest 7 RealTime/IntraDay
- VectorVest AutoTester
- VectorVest Educational Services
- VectorVest OnLine
- VectorVest Options Analyzer
- VectorVest ProGraphics v6.0
- VectorVest ProTrader 7
- VectorVest RealTime Derby Tool
- VectorVest Simulator
- VectorVest Variator
- VectorVest Watchdog
- StockCharts.com, Inc.
- Candle Patterns
- Candlestick Charting Explained
- Intermarket Technical Analysis
- John Murphy on Chart Analysis
- John Murphy's Chart Pattern Recognition
- John Murphy's Market Message
- MurphyExplainsMarketAnalysis-Intermarket Analysis
- MurphyExplainsMarketAnalysis-Visual Analysis
- StockCharts.com
- Technical Analysis of the Financial Markets
- The Visual Investor
