HOT TOPICS LIST
- MACD
- Fibonacci
- RSI
- Gann
- ADXR
- Stochastics
- Volume
- Triangles
- Futures
- Cycles
- Volatility
- ZIGZAG
- MESA
- Retracement
- Aroon
INDICATORS LIST
LIST OF TOPICS
PRINT THIS ARTICLE
by Ashwani Gujral
Adtran is a stock doing everything right in an uptrend, rising from bullish head and shoulders pattern and being marked by bull flags on the way. The shorter-term moving averages are crossing over the longer-term moving averages from below. These are perfect characteristics of a strong uptrend.
Position: Buy
Ashwani Gujral
He is founder of AGIP Securities Pvt. Ltd. which offers money management services, live chat rooms (during market hours) and independent technical analysis consultancy. The company has a big media presence from the likes of CNBC, NDTV Profit, and ZEE Business.
PRINT THIS ARTICLE
FLAGS AND PENNANTS
Adtran Bottoms Out
06/06/05 08:51:09 AMby Ashwani Gujral
Adtran is a stock doing everything right in an uptrend, rising from bullish head and shoulders pattern and being marked by bull flags on the way. The shorter-term moving averages are crossing over the longer-term moving averages from below. These are perfect characteristics of a strong uptrend.
Position: Buy
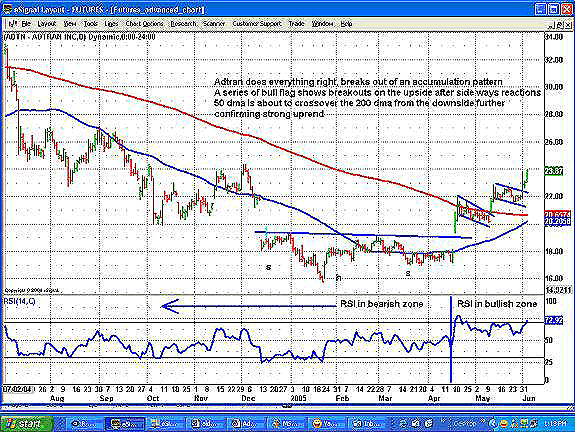
| The Dow theory defines trends in a manner that has stood the test of time. If traders remember only one concept from technical analysis, it is that an uptrend consists of higher lows and higher bottoms, while a downtrend consists of lower tops and bottoms. Over time, technical analysts have overcomplicated this very simple concept, splitting it into a variety of theories, leading it to the same basic premise of trends. A technical analyst who wants to be a good trader needs to eliminate the wheat from chaff; he needs to confirm the basic definition of trends with the help of a confluence of indicators, and not the other way around. After all, a stock breaks out of an accumulation pattern and goes through consolidations while it continues to rise. This is confirmed by shorter-term moving averages (for example, a 50-day double moving average) crossing above longer-term averages (200-day DMA). This is being complemented by the relative strength index (RSI) remaining above a level of 60. This is all the bias an astute trader needs. |

|
| Figure 1: Adtran daily chart |
| Graphic provided by: eSignal. |
| |
| On the daily chart (Figure 1), Adtran breaks out from head and shoulders pattern. This is followed by a couple of bull flags, showing a clear uptrend. This uptrend is further confirmed by the 50-day DMA about to cross over above the 200-day DMA. The RSI(14), which found resistance earlier at the level of 60 and was in bearish zone, now crosses above 60 and finds support on it. Hence, the RSI(14) also is in a bullish zone. From a trading perspective, Adtran can be bought each time RSI corrects to the 60 level or the stock corrects below the 20-day DMA and comes back above it. |

|
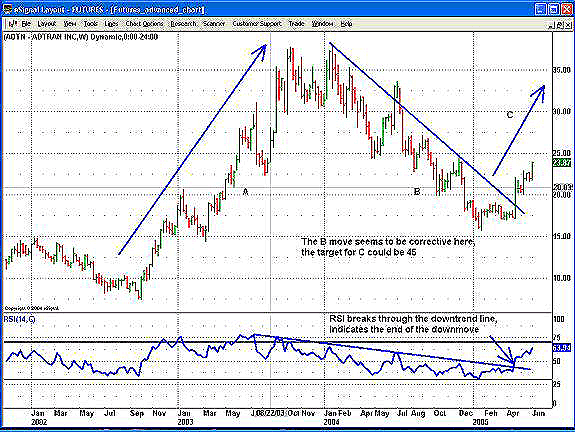
| Figure 2: Adtran weekly chart |
| Graphic provided by: eSignal. |
| |
| On the weekly chart (Figure 2), we try to divide the stock move into an ABC pattern. Here, we observe that the main move A is categorized as the main trend, which goes through a reactive move B. The reaction can be considered over as the nine-month trendline is broken on the upside and the stock begins a move C. A target for C can be determined by measuring A from 7 to 37 level, and then adding 30 points to the 15 level, which is considered as the end of the reactive move B, hence arriving at a medium-term target of 45. |
He is founder of AGIP Securities Pvt. Ltd. which offers money management services, live chat rooms (during market hours) and independent technical analysis consultancy. The company has a big media presence from the likes of CNBC, NDTV Profit, and ZEE Business.
| Title: | Chief mkt strategist |
| Company: | AGIP Securities |
| India | |
| Phone # for sales: | 9871066337 |
| Website: | www.ashwanigujral.com |
| E-mail address: | contact@ashwanigujral.com |
Traders' Resource Links | |
| AGIP Securities has not added any product or service information to TRADERS' RESOURCE. | |
Click here for more information about our publications!
Comments
Date: 06/06/05Rank: 5Comment:

Request Information From Our Sponsors
- StockCharts.com, Inc.
- Candle Patterns
- Candlestick Charting Explained
- Intermarket Technical Analysis
- John Murphy on Chart Analysis
- John Murphy's Chart Pattern Recognition
- John Murphy's Market Message
- MurphyExplainsMarketAnalysis-Intermarket Analysis
- MurphyExplainsMarketAnalysis-Visual Analysis
- StockCharts.com
- Technical Analysis of the Financial Markets
- The Visual Investor
- VectorVest, Inc.
- Executive Premier Workshop
- One-Day Options Course
- OptionsPro
- Retirement Income Workshop
- Sure-Fire Trading Systems (VectorVest, Inc.)
- Trading as a Business Workshop
- VectorVest 7 EOD
- VectorVest 7 RealTime/IntraDay
- VectorVest AutoTester
- VectorVest Educational Services
- VectorVest OnLine
- VectorVest Options Analyzer
- VectorVest ProGraphics v6.0
- VectorVest ProTrader 7
- VectorVest RealTime Derby Tool
- VectorVest Simulator
- VectorVest Variator
- VectorVest Watchdog
