HOT TOPICS LIST
- MACD
- Fibonacci
- RSI
- Gann
- ADXR
- Stochastics
- Volume
- Triangles
- Futures
- Cycles
- Volatility
- ZIGZAG
- MESA
- Retracement
- Aroon
INDICATORS LIST
LIST OF TOPICS
PRINT THIS ARTICLE
by Ashwani Gujral
Davita completes a consolidation, breaks out of 45, and seems to be entering a strong uptrend again as momentum picks up.
Position: Buy
Ashwani Gujral
He is founder of AGIP Securities Pvt. Ltd. which offers money management services, live chat rooms (during market hours) and independent technical analysis consultancy. The company has a big media presence from the likes of CNBC, NDTV Profit, and ZEE Business.
PRINT THIS ARTICLE
CONSOLID FORMATION
Davita Consolidates, Starts Up
06/06/05 08:20:29 AMby Ashwani Gujral
Davita completes a consolidation, breaks out of 45, and seems to be entering a strong uptrend again as momentum picks up.
Position: Buy
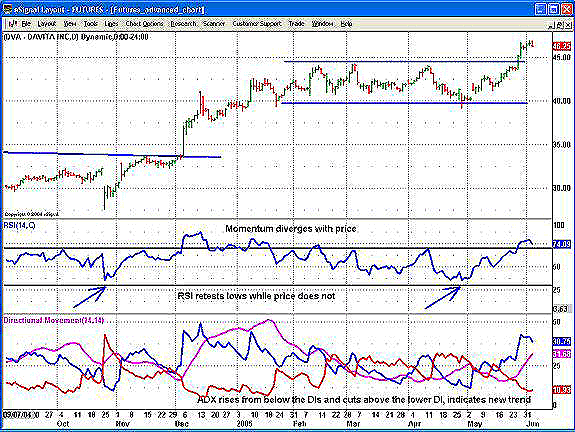
| In technical analysis, unless it's a strongly trending market, most indicators are lagging indicators and are hence of lesser use than leading ones. But what are these leading indicators? There is no better leading indicator of a stock price than the price itself. The other leading indicator I like to use is momentum. If the price movement is confirmed by momentum indicators, it's a potent combination in terms of getting a trader into the move early. In general, price follows momentum. If momentum makes a low and the market does not, this indicates strength in the market. If momentum makes a high and the market does not, this indicates weakness. |

|
| Figure 1: Davita daily chart |
| Graphic provided by: eSignal. |
| |
| On the daily chart (Figure 1), the first arrow shows a relative strength index (RSI) low, after which the stock rallies and then goes into a sideways consolidation. The RSI corrects down to its earlier low while the stock remains sideways. Hence, the stock shows strength as it holds its earlier level, even though momentum touches its earlier low. So as the RSI turns up, the stock can be expected to move higher. This is a key concept as it provides leading information about the stock's movement after a consolidation. One dilemma that a trader faces on a daily basis is to decide whether a sideways move is a consolidation or distribution. The daily average directional movement index (ADX) has risen from below the directional index (DI), crossing above them and rising above 20, indicating a strong new trend. |

|
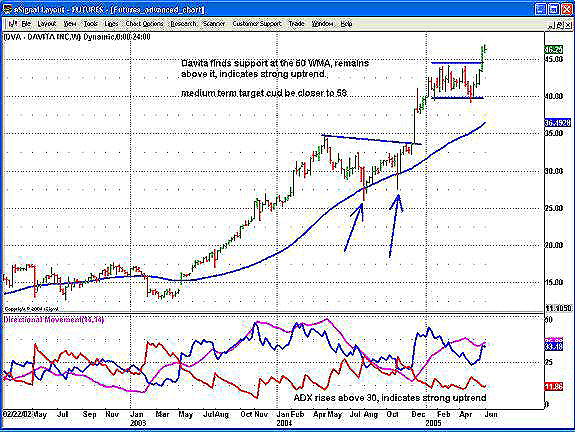
| Figure 2: Davita weekly chart |
| Graphic provided by: eSignal. |
| |
| On the weekly chart (Figure 2), Davita continues to trade above an upward sloping 50-period weighted moving average (WMA) and hence remains in a strong uptrend. The stock is also showing period consolidation and buying from levels. The target of this move can be measured by taking the move from 26 to 44 and then adding it to the bottom of the second sideways consolidation (which is 40), leading to a target of 58. The ADX remains above 30, confirming the presence of a strong trend. |
He is founder of AGIP Securities Pvt. Ltd. which offers money management services, live chat rooms (during market hours) and independent technical analysis consultancy. The company has a big media presence from the likes of CNBC, NDTV Profit, and ZEE Business.
| Title: | Chief mkt strategist |
| Company: | AGIP Securities |
| India | |
| Phone # for sales: | 9871066337 |
| Website: | www.ashwanigujral.com |
| E-mail address: | contact@ashwanigujral.com |
Traders' Resource Links | |
| AGIP Securities has not added any product or service information to TRADERS' RESOURCE. | |
Click here for more information about our publications!
Comments
Date: 06/06/05Rank: 5Comment:

Request Information From Our Sponsors
- StockCharts.com, Inc.
- Candle Patterns
- Candlestick Charting Explained
- Intermarket Technical Analysis
- John Murphy on Chart Analysis
- John Murphy's Chart Pattern Recognition
- John Murphy's Market Message
- MurphyExplainsMarketAnalysis-Intermarket Analysis
- MurphyExplainsMarketAnalysis-Visual Analysis
- StockCharts.com
- Technical Analysis of the Financial Markets
- The Visual Investor
- VectorVest, Inc.
- Executive Premier Workshop
- One-Day Options Course
- OptionsPro
- Retirement Income Workshop
- Sure-Fire Trading Systems (VectorVest, Inc.)
- Trading as a Business Workshop
- VectorVest 7 EOD
- VectorVest 7 RealTime/IntraDay
- VectorVest AutoTester
- VectorVest Educational Services
- VectorVest OnLine
- VectorVest Options Analyzer
- VectorVest ProGraphics v6.0
- VectorVest ProTrader 7
- VectorVest RealTime Derby Tool
- VectorVest Simulator
- VectorVest Variator
- VectorVest Watchdog
