HOT TOPICS LIST
- MACD
- Fibonacci
- RSI
- Gann
- ADXR
- Stochastics
- Volume
- Triangles
- Futures
- Cycles
- Volatility
- ZIGZAG
- MESA
- Retracement
- Aroon
INDICATORS LIST
LIST OF TOPICS
PRINT THIS ARTICLE
by David Penn
Those ominous divergences in the S&P 500's hourly chart are beginning to show up on the daily.
Position: N/A
David Penn
Technical Writer for Technical Analysis of STOCKS & COMMODITIES magazine, Working-Money.com, and Traders.com Advantage.
PRINT THIS ARTICLE
CHANNEL LINES
Channel Tops And Divergences
06/06/05 07:54:46 AMby David Penn
Those ominous divergences in the S&P 500's hourly chart are beginning to show up on the daily.
Position: N/A
| In a late May article for Traders.com Advantage ("Will Divergences Doom The Rally?" May 23, 2005), I pointed out a running negative stochastic divergence in the then-week old rally from the mid-May lows. |
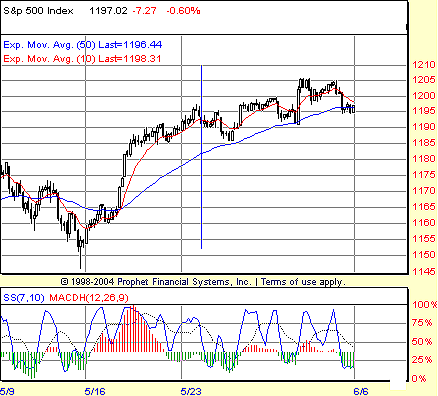
| Since then, when the Standard & Poor's 500 was pushing up against the 1192 level, the buyers have managed to push the S&P 500 even higher (Figure 1). But while those hourly divergences did not mark the top in the rally, they may have fundamentally changed the nature of the advance. Whereas the earlier days of the rally saw the S&P 500 move strongly through May 23 with very little if any retracement, the advance since that date has been a halting, wedge-shaped affair with each new high plagued by a correction that took out the previous high. No "don't look back" breakouts here! |

|
| Figure 1: S&P 500, hourly chart. Compare the rally's first week with its second, as divided by the blue line in the hourly chart. |
| Graphic provided by: Prophet Financial, Inc. |
| |
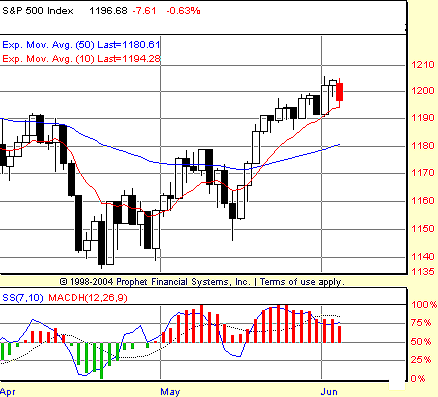
| And not surprisingly, this choppy trading in the S&P 500's hourly chart has translated into still more negative stochastic divergences. These divergences, however, are now appearing on the daily chart--and are giving credence to the notion that investors and speculators are in the late innings of the market's move off the April lows (Figure 2). |

|
| Figure 2: The first negative stochastic divergence in the S&P 500's rally from the April 2005 lows develops over the second half of May. |
| Graphic provided by: Prophet Financial, Inc. |
| |
| The first negative divergence develops between the consecutively higher price highs on May 23 and 27, and the corresponding consecutively lower highs in the 7,10 stochastic. Still another negative divergence appears with the higher high in price on June 2, higher highs that are matched by a stochastic peak that is lower than either of the stochastic peaks on May 27 or May 23. So far, none of these negative divergences have been confirmed by followthrough price action to the downside (though, as of this writing, the jury on the June 2nd divergence remains in deliberations). There were a number of downside targets that would have confirmed the negative divergence: the divergence between May 23 and May 27 would have required a downside move below the May 31st lows to about 1188. The more recent divergence would require a move below the June 3rd lows to about the same level, roughly 1189. It is worth adding that some of the more powerful signals can come from targets that are not reached. In other words, if the S&P 500 fails to retrace to the 1188-1189 level in the near term, then it could be a signal that the market is ready to move significantly higher. |

|
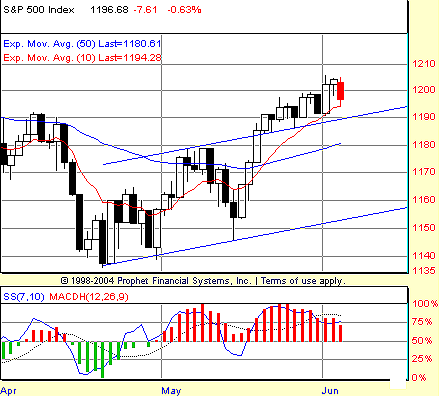
| Figure 3: After breaking out above a six-week trend channel, the S&P 500 manages to find support on the channel's upper boundary. |
| Graphic provided by: Prophet Financial, Inc. |
| |
| These negative divergences come in a context in which the S&P 500 has broken out of its old trend and embarked upon a new steeper one. Interestingly, what was once resistance in the form of the old trend channel's upper boundary is currently serving as support as the S&P 500 moves higher. In the immediate term, this is a sign of strength--for it will probably take a breach of that upper boundary before sellers will feel any conviction to push the S&P 500 lower (Figure 3). The 10-day exponential moving average (EMA) is currently providing the most immediate support to the advance in the S&P 500, with the upper boundary of the old trend channel not far behind. These two should serve as the most immediate test of the rally's strength--a breach of one would most likely mean a breach of the other. And should that breach occur, then the S&P 500 will be facing an even more serious confrontation with support at the 50-day EMA and, if the sellers are bold enough, a test of the lower boundary of the trend channel as well. |
Technical Writer for Technical Analysis of STOCKS & COMMODITIES magazine, Working-Money.com, and Traders.com Advantage.
| Title: | Technical Writer |
| Company: | Technical Analysis, Inc. |
| Address: | 4757 California Avenue SW |
| Seattle, WA 98116 | |
| Phone # for sales: | 206 938 0570 |
| Fax: | 206 938 1307 |
| Website: | www.Traders.com |
| E-mail address: | DPenn@traders.com |
Traders' Resource Links | |
| Charting the Stock Market: The Wyckoff Method -- Books | |
| Working-Money.com -- Online Trading Services | |
| Traders.com Advantage -- Online Trading Services | |
| Technical Analysis of Stocks & Commodities -- Publications and Newsletters | |
| Working Money, at Working-Money.com -- Publications and Newsletters | |
| Traders.com Advantage -- Publications and Newsletters | |
| Professional Traders Starter Kit -- Software | |
Click here for more information about our publications!
Comments
Date: 06/06/05Rank: 3Comment:
Date: 06/07/05Rank: 4Comment:
Date: 06/23/05Rank: 4Comment:

Request Information From Our Sponsors
- StockCharts.com, Inc.
- Candle Patterns
- Candlestick Charting Explained
- Intermarket Technical Analysis
- John Murphy on Chart Analysis
- John Murphy's Chart Pattern Recognition
- John Murphy's Market Message
- MurphyExplainsMarketAnalysis-Intermarket Analysis
- MurphyExplainsMarketAnalysis-Visual Analysis
- StockCharts.com
- Technical Analysis of the Financial Markets
- The Visual Investor
- VectorVest, Inc.
- Executive Premier Workshop
- One-Day Options Course
- OptionsPro
- Retirement Income Workshop
- Sure-Fire Trading Systems (VectorVest, Inc.)
- Trading as a Business Workshop
- VectorVest 7 EOD
- VectorVest 7 RealTime/IntraDay
- VectorVest AutoTester
- VectorVest Educational Services
- VectorVest OnLine
- VectorVest Options Analyzer
- VectorVest ProGraphics v6.0
- VectorVest ProTrader 7
- VectorVest RealTime Derby Tool
- VectorVest Simulator
- VectorVest Variator
- VectorVest Watchdog
