HOT TOPICS LIST
- MACD
- Fibonacci
- RSI
- Gann
- ADXR
- Stochastics
- Volume
- Triangles
- Futures
- Cycles
- Volatility
- ZIGZAG
- MESA
- Retracement
- Aroon
INDICATORS LIST
LIST OF TOPICS
PRINT THIS ARTICLE
by Koos van der Merwe
Is Sherritt taking a breather before continuing its climb?
Position: Buy
Koos van der Merwe
Has been a technical analyst since 1969, and has worked as a futures and options trader with First Financial Futures in Johannesburg, South Africa.
PRINT THIS ARTICLE
ELLIOTT WAVE
Is Sherritt International Taking A Breather?
06/03/05 11:20:19 AMby Koos van der Merwe
Is Sherritt taking a breather before continuing its climb?
Position: Buy
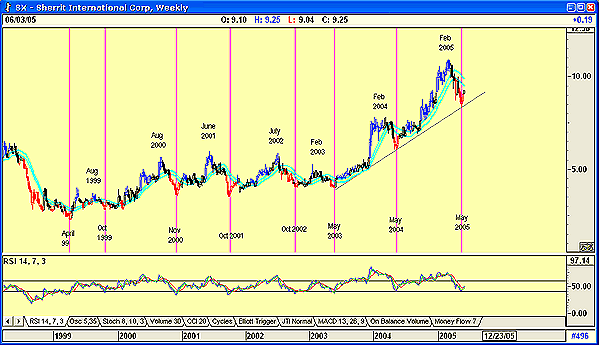
| Sherritt International Corp. is a diversified natural resource company that operates in Canada, Cuba, and other international venues. Directly and through its subsidiaries, it has interests in thermal coal production; a nickel/cobalt metals business; oil and gas exploration, development and production; and electricity generation, and Figure 1 shows how the company's share price grew from April 1999 when the share price was $2.30 to a high of $10.90 in March 2005. |

|
| Figure 1: Sherritt International, weekly chart |
| Graphic provided by: AdvancedGET. |
| |
| Since then, the price has fallen to its present level of $9.25 after having tested the support line and bounced off it. What is curious is that the price appears to be following a cyclical pattern. From the low of April 1999, the share price appears to have made a bottom every October, with a high around June, July, or August. This pattern is very clear in the weekly chart (Figure 1). Then from October 2002, the pattern changed, shifting by six months. It now made highs in February and lows in May. |
| When a cyclical pattern changes by 50% as shown, it is usually a sign that the trend has changed. In the case of Sherritt, it changed from a slightly bullish sideways pattern to a strongly bullish pattern. Should the share price continue to follow this pattern, we can expect the share price to continue rising until February 2006. The relative strength index (RSI) seems to confirm this. |

|
| Figure 2: Sherritt International, daily chart |
| Graphic provided by: AdvancedGET. |
| |
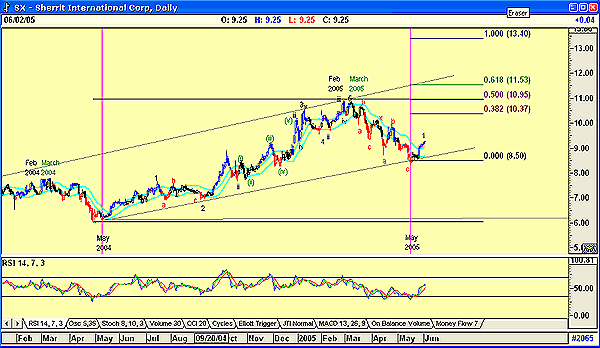
| The daily chart (Figure 2) does not tell much more than the weekly chart, with the exception that the price tops appear to be in March, rather than February. The bounce off the long-term trendline is also in place and coincides with an RSI signal showing a buy. A Fibonacci extension of the rise from March 2004 to March 2005 suggests the following target levels: 38.2% = $10.37 50% = 10.95, the high of March 2005. 61.8% = $11.53, the most likely We could expect the price to rise to $13.40, which will be equal to the rise from March 2004 to March 2005. |
| Finally, the wave count suggests that a new impulse wave is starting, with wave 1 in place. This would see a wave 2 correction to be a good buying opportunity. This is a stock you could buy at present levels and hold for the long term. |
Has been a technical analyst since 1969, and has worked as a futures and options trader with First Financial Futures in Johannesburg, South Africa.
| Address: | 3256 West 24th Ave |
| Vancouver, BC | |
| Phone # for sales: | 6042634214 |
| E-mail address: | petroosp@gmail.com |
Click here for more information about our publications!
Comments
Date: 06/03/05Rank: 3Comment:

Request Information From Our Sponsors
- VectorVest, Inc.
- Executive Premier Workshop
- One-Day Options Course
- OptionsPro
- Retirement Income Workshop
- Sure-Fire Trading Systems (VectorVest, Inc.)
- Trading as a Business Workshop
- VectorVest 7 EOD
- VectorVest 7 RealTime/IntraDay
- VectorVest AutoTester
- VectorVest Educational Services
- VectorVest OnLine
- VectorVest Options Analyzer
- VectorVest ProGraphics v6.0
- VectorVest ProTrader 7
- VectorVest RealTime Derby Tool
- VectorVest Simulator
- VectorVest Variator
- VectorVest Watchdog
- StockCharts.com, Inc.
- Candle Patterns
- Candlestick Charting Explained
- Intermarket Technical Analysis
- John Murphy on Chart Analysis
- John Murphy's Chart Pattern Recognition
- John Murphy's Market Message
- MurphyExplainsMarketAnalysis-Intermarket Analysis
- MurphyExplainsMarketAnalysis-Visual Analysis
- StockCharts.com
- Technical Analysis of the Financial Markets
- The Visual Investor
