HOT TOPICS LIST
- MACD
- Fibonacci
- RSI
- Gann
- ADXR
- Stochastics
- Volume
- Triangles
- Futures
- Cycles
- Volatility
- ZIGZAG
- MESA
- Retracement
- Aroon
INDICATORS LIST
LIST OF TOPICS
PRINT THIS ARTICLE
by Dennis D. Peterson
A bowl pattern is a reversal pattern that frequently occurs in financial markets. It can be a strong predictor of price increase. Also known as a saucer pattern, the bowl can have an opposite called an inverted bowl which can be a strong predictor for price decrease.
Position: N/A
Dennis D. Peterson
Market index trading on a daily basis.
PRINT THIS ARTICLE
RECURRENT PATTERNS
Bowl Pattern
07/11/00 02:56:06 PMby Dennis D. Peterson
A bowl pattern is a reversal pattern that frequently occurs in financial markets. It can be a strong predictor of price increase. Also known as a saucer pattern, the bowl can have an opposite called an inverted bowl which can be a strong predictor for price decrease.
Position: N/A
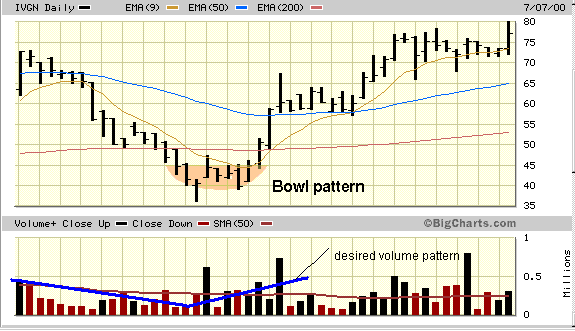
| Bowl patterns look like another recurring pattern, the rounding bottom, both of which have slowing retracing prices. They are not sharp downswings. Instead, they drop lower by slowly curving down and flattening out like a bowl or saucer. After reaching their low, prices move horizontally for awhile before they start their quick climb up. |
| Confirmation is seen in the volume data. The downtrend has increasing volume, with reduced volume at the bottom, and then at the upturn the volume again increases. |

|
| Figure 1: Daily price chart for IVGN. Here you see a bowl pattern with confirming volume data. |
| Graphic provided by: BigCharts.com |
| |
| A recent bowl pattern can be seen on the chart of Invitrogen Corp. (IVGN). Overlaid on the chart are moving averages at 9-, 50-, and 200-days. Moving averages, which are lagging indicators, reduce some of the noise in the data. The bowl is most clearly seen using the 9-day moving average. Being a lagging indicator the 9-day MA is shifted to the right. |
| Bowl upturns are not without interruptions [1]. What is desired at this point is a leading indicator to confirm the pattern formation. Two leading indicators are the on-balance volume (OBV) [2], and money flow [2]. These two momentum indicators also confirm that the money and volume are flowing into IVGN. |
| [1] Robert G. Edwards, John Magee, Technical Analysis of Stock Trends [2] Steven B. Achelis, Technical Analysis From A to Z |
Market index trading on a daily basis.
| Title: | Staff Writer |
| Company: | Technical Analysis, Inc. |
| Address: | 4757 California Ave SW |
| Seattle, WA 98116-4499 | |
| Phone # for sales: | 206 938 0570 |
| Fax: | 206 938 1307 |
| Website: | www.traders.com |
| E-mail address: | dpeterson@traders.com |
Traders' Resource Links | |
| Charting the Stock Market: The Wyckoff Method -- Books | |
| Working-Money.com -- Online Trading Services | |
| Traders.com Advantage -- Online Trading Services | |
| Technical Analysis of Stocks & Commodities -- Publications and Newsletters | |
| Working Money, at Working-Money.com -- Publications and Newsletters | |
| Traders.com Advantage -- Publications and Newsletters | |
| Professional Traders Starter Kit -- Software | |
Click here for more information about our publications!
Comments

Request Information From Our Sponsors
- StockCharts.com, Inc.
- Candle Patterns
- Candlestick Charting Explained
- Intermarket Technical Analysis
- John Murphy on Chart Analysis
- John Murphy's Chart Pattern Recognition
- John Murphy's Market Message
- MurphyExplainsMarketAnalysis-Intermarket Analysis
- MurphyExplainsMarketAnalysis-Visual Analysis
- StockCharts.com
- Technical Analysis of the Financial Markets
- The Visual Investor
- VectorVest, Inc.
- Executive Premier Workshop
- One-Day Options Course
- OptionsPro
- Retirement Income Workshop
- Sure-Fire Trading Systems (VectorVest, Inc.)
- Trading as a Business Workshop
- VectorVest 7 EOD
- VectorVest 7 RealTime/IntraDay
- VectorVest AutoTester
- VectorVest Educational Services
- VectorVest OnLine
- VectorVest Options Analyzer
- VectorVest ProGraphics v6.0
- VectorVest ProTrader 7
- VectorVest RealTime Derby Tool
- VectorVest Simulator
- VectorVest Variator
- VectorVest Watchdog
