HOT TOPICS LIST
- MACD
- Fibonacci
- RSI
- Gann
- ADXR
- Stochastics
- Volume
- Triangles
- Futures
- Cycles
- Volatility
- ZIGZAG
- MESA
- Retracement
- Aroon
INDICATORS LIST
LIST OF TOPICS
PRINT THIS ARTICLE
by David Penn
"Best in breed" broker or "penultimate hedge fund"?
Position: N/A
David Penn
Technical Writer for Technical Analysis of STOCKS & COMMODITIES magazine, Working-Money.com, and Traders.com Advantage.
PRINT THIS ARTICLE
REVERSAL
Goldman Sachs: From 2B Top To Stochastic Bounce
06/02/05 08:03:46 AMby David Penn
"Best in breed" broker or "penultimate hedge fund"?
Position: N/A
| Goldman Sachs is increasingly coming up in contexts I'm sure would not please its shareholders. It's not as if those who own GS stock need any special context to stoke their discontent. Ever since topping out in April, shares of Goldman Sachs have fallen from a high just shy of 115 to as low as 95 late in May. |
The most recent reference was a piece by Raymond James analyst Jeffrey Saut who, writing about the current market environment, observed that:
|

|
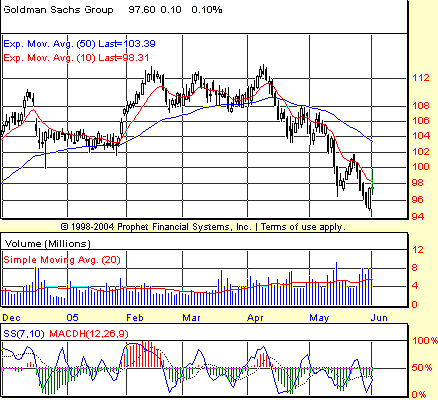
| Figure 1: Goldman Sachs. The consolidation range from February to mid-April turned out to be a topping pattern as shares of GS rolled over and down, crashing beneath both 10- and 50-day exponential moving averages. |
| Graphic provided by: Prophet Financial, Inc. |
| |
| Sounds like good advice to me! But the saga of Goldman Sachs' recent decline is best told from the beginning, and as far as the present decline is concerned, the beginning is in the April highs. Not only do the April highs come with a negative stochastic divergence (compare the higher price high in April vis-a-vis February with the lower stochastic high in April vis-a-vis February), but they also brought with them a 2B top insofar as the higher high on April 7 shows no followthrough to the upside. By April 11, GS has fallen below the low of the previous major high (made on February 11) and is considered shortable based on the 2B criteria. Since then, Goldman Sachs has been a short-seller's delight--falling for 11 straight days off the peak without so much as a higher intraday high. Mid-April to the beginning of May saw what we can now tell was clearly distribution as the trading range that developed over those few weeks broke down, leading to still-lower prices for shares of Goldman Sachs. |
| It appears, however, that the declining days may be done for Goldman Sachs--at least for the time being. Ever since the mid-May lows, Goldman Sachs has been working to create a positive stochastic divergence. The appearance of such a divergence would be a strong signal that the downside in GS was increasingly limited, perhaps spurring some bottom-feeding traders to start bidding up Goldman shares. While that positive stochastic divergence was in fact created, the rally that followed from it turned out to be better treated as a sellable bounce than as an opportunity to go long. So what can we make of the newest positive stochastic divergence between the April lows and the end of May/beginning of June lows? Is there any reason to believe it will be more lucrative for longs than was the previous divergence involving the mid-May lows? |
| As the moving average convergence/divergence histogram (MACDH) shows, the bears are pretty overwhelming in Goldman Sachs. The histogram is higher in May than in April and higher in June (so far) than in either of the two previous months--which is relatively bullish. Yet the fact that the histogram remains in negative territory is not a positive for higher prices. What it does do is contribute toward the sort of excessive oversold condition whence bounces--and often quite powerful ones--are born. The entry rule I follow would have allowed for a bottom-feeding, swing long entry at 98.98, just a few cents beyond the June 1st high. This suggests it might take a bit more bounce to convince more traders to take a chance at Goldman ability to buck a two-month downtrend. |
Technical Writer for Technical Analysis of STOCKS & COMMODITIES magazine, Working-Money.com, and Traders.com Advantage.
| Title: | Technical Writer |
| Company: | Technical Analysis, Inc. |
| Address: | 4757 California Avenue SW |
| Seattle, WA 98116 | |
| Phone # for sales: | 206 938 0570 |
| Fax: | 206 938 1307 |
| Website: | www.Traders.com |
| E-mail address: | DPenn@traders.com |
Traders' Resource Links | |
| Charting the Stock Market: The Wyckoff Method -- Books | |
| Working-Money.com -- Online Trading Services | |
| Traders.com Advantage -- Online Trading Services | |
| Technical Analysis of Stocks & Commodities -- Publications and Newsletters | |
| Working Money, at Working-Money.com -- Publications and Newsletters | |
| Traders.com Advantage -- Publications and Newsletters | |
| Professional Traders Starter Kit -- Software | |
Click here for more information about our publications!
Comments
Date: 06/02/05Rank: 3Comment:

Request Information From Our Sponsors
- StockCharts.com, Inc.
- Candle Patterns
- Candlestick Charting Explained
- Intermarket Technical Analysis
- John Murphy on Chart Analysis
- John Murphy's Chart Pattern Recognition
- John Murphy's Market Message
- MurphyExplainsMarketAnalysis-Intermarket Analysis
- MurphyExplainsMarketAnalysis-Visual Analysis
- StockCharts.com
- Technical Analysis of the Financial Markets
- The Visual Investor
- VectorVest, Inc.
- Executive Premier Workshop
- One-Day Options Course
- OptionsPro
- Retirement Income Workshop
- Sure-Fire Trading Systems (VectorVest, Inc.)
- Trading as a Business Workshop
- VectorVest 7 EOD
- VectorVest 7 RealTime/IntraDay
- VectorVest AutoTester
- VectorVest Educational Services
- VectorVest OnLine
- VectorVest Options Analyzer
- VectorVest ProGraphics v6.0
- VectorVest ProTrader 7
- VectorVest RealTime Derby Tool
- VectorVest Simulator
- VectorVest Variator
- VectorVest Watchdog
