HOT TOPICS LIST
- MACD
- Fibonacci
- RSI
- Gann
- ADXR
- Stochastics
- Volume
- Triangles
- Futures
- Cycles
- Volatility
- ZIGZAG
- MESA
- Retracement
- Aroon
INDICATORS LIST
LIST OF TOPICS
PRINT THIS ARTICLE
by Koos van der Merwe
After the announcement on June 1 that DreamWorks had acquired the North American distribution rights to Woody Allen's latest film, the share price jumped up 1.63%. But why, then ...
Position: Accumulate
Koos van der Merwe
Has been a technical analyst since 1969, and has worked as a futures and options trader with First Financial Futures in Johannesburg, South Africa.
PRINT THIS ARTICLE
CANDLESTICK CHARTING
Let Us Dream About DreamWorks
06/02/05 10:14:19 AMby Koos van der Merwe
After the announcement on June 1 that DreamWorks had acquired the North American distribution rights to Woody Allen's latest film, the share price jumped up 1.63%. But why, then ...
Position: Accumulate
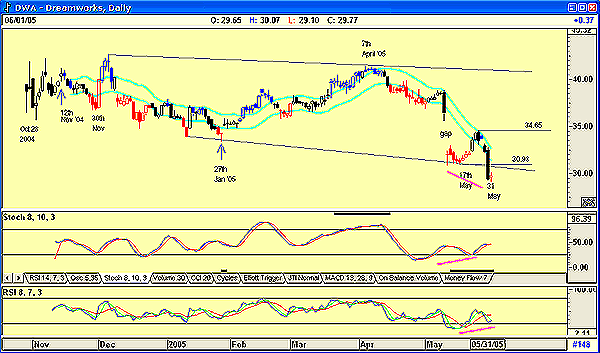
| Why has the company that made Shrek, Shrek II, Shark Tale, and now Madagascar, its newest feature-length cartoon, been receiving poor reports from the likes of Lehman Brothers and other brokerage houses? During the US Memorial Day weekend, Madagascar brought in $61 million in US box offices. How much more will it make with peripheral sales? Without analyzing the fundamentals of the company, or taking into account films in the pipeline like Shrek III, what are the technicals telling us? |

|
| Figure 1: DreamWorks daily. To dream or not to dream ... that is the question. |
| Graphic provided by: AdvancedGET. |
| |
| Figure 1 is a daily chart that shows how DreamWorks came onto the market in October 2004, opening at $39.50 and closing at $38.75. We would have expected it to rise after the first day's trading, and it did, rising to $41.19 by November 12, but then it fell to $36.70 by November 30. Within three days, it was back up to $42.60, but gradually sank to a low of $33.38 by January 2005. From this level, the share price gradually rose to a high of $41.28 by April 7, 2005. |
| After reaching a new high on April 7, the company was downgraded by various brokerages for various reasons. Those comments hurt the stock price, which dropped on a gap to a low of $30.97 by May 17. There was a slight recovery, and then a further drop to $29.10 on May 31 when yet another analyst at Lehman gave it a poor report, perhaps based on the box office of Madagascar on Memorial Day. Possibly the analyst had seen the movie and judged it not up to expectations--in other words, not another Shrek. What now for the share price? |
Technically, the price should by all accounts trend lower, as it has broken below a major support trendline. However, the chart does show the following positives:
|
| To conclude, we could start accumulating DreamWorks at present levels based on the two indicators, and add to our purchases as it moves above $30.98 and $34.65. Go, Shrek! Go! |
Has been a technical analyst since 1969, and has worked as a futures and options trader with First Financial Futures in Johannesburg, South Africa.
| Address: | 3256 West 24th Ave |
| Vancouver, BC | |
| Phone # for sales: | 6042634214 |
| E-mail address: | petroosp@gmail.com |
Click here for more information about our publications!
Comments
Date: 06/02/05Rank: 3Comment:

Request Information From Our Sponsors
- VectorVest, Inc.
- Executive Premier Workshop
- One-Day Options Course
- OptionsPro
- Retirement Income Workshop
- Sure-Fire Trading Systems (VectorVest, Inc.)
- Trading as a Business Workshop
- VectorVest 7 EOD
- VectorVest 7 RealTime/IntraDay
- VectorVest AutoTester
- VectorVest Educational Services
- VectorVest OnLine
- VectorVest Options Analyzer
- VectorVest ProGraphics v6.0
- VectorVest ProTrader 7
- VectorVest RealTime Derby Tool
- VectorVest Simulator
- VectorVest Variator
- VectorVest Watchdog
- StockCharts.com, Inc.
- Candle Patterns
- Candlestick Charting Explained
- Intermarket Technical Analysis
- John Murphy on Chart Analysis
- John Murphy's Chart Pattern Recognition
- John Murphy's Market Message
- MurphyExplainsMarketAnalysis-Intermarket Analysis
- MurphyExplainsMarketAnalysis-Visual Analysis
- StockCharts.com
- Technical Analysis of the Financial Markets
- The Visual Investor
