HOT TOPICS LIST
- MACD
- Fibonacci
- RSI
- Gann
- ADXR
- Stochastics
- Volume
- Triangles
- Futures
- Cycles
- Volatility
- ZIGZAG
- MESA
- Retracement
- Aroon
INDICATORS LIST
LIST OF TOPICS
PRINT THIS ARTICLE
by Arthur Hill
Maxtor has a large inverse head-and-shoulders pattern working and looks ripe for a neckline test.
Position: Accumulate
Arthur Hill
Arthur Hill is currently editor of TDTrader.com, a website specializing in trading strategies, sector/industry specific breadth stats and overall technical analysis. He passed the Society of Technical Analysts (STA London) diploma exam with distinction is a Certified Financial Technician (CFTe). Prior to TD Trader, he was the Chief Technical Analyst for Stockcharts.com and the main contributor to the ChartSchool.
PRINT THIS ARTICLE
HEAD & SHOULDERS
Maxtor Consolidates As Head-and-Shoulders Formation Evolves
06/01/05 12:00:54 PMby Arthur Hill
Maxtor has a large inverse head-and-shoulders pattern working and looks ripe for a neckline test.
Position: Accumulate
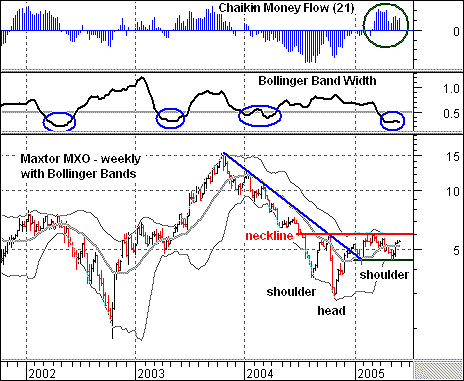
| On the weekly candlestick chart (Figure 1), the inverse head-and-shoulders pattern extends from July 2004 to May 2005. This is a massive pattern, and a breakout would result in a significant trend change. The right shoulder is still a work in progress and would not be completed until the stock moves up to neckline resistance at 6. The stock broke the (blue) trendline extending down from October 2003 and the right shoulder represents a consolidation after this breakout. |

|
| Figure 1: MXO. The inverse head-and-shoulders pattern extends from July 2004 to May 2005. This is a massive pattern, and a breakout would result in a significant trend change. |
| Graphic provided by: MetaStock. |
| Graphic provided by: Reuters Data. |
| |
| As the consolidation unfolds, Bollinger Bands have contracted to their narrowest level in more than two years. Such a narrowing of the bands represents a consolidation, and this usually precedes a significant move. As the blue circles indicate, prior moves below 0.5 preceded big moves in 2002, 2003, and 2004. Look for a move back above 0.5 to signal the start of the next significant move. |
| The Chaikin money flow suggests that the next move will be up. The indicator was negative most of 2004 and turned positive in March 2005. This volume-based indicator measures accumulation and distribution. As long as it remains in positive territory, the forces of accumulation are winning and a breakout above 6 should be expected. The low of the head is around 3 and a breakout would target further strength to around 9. There is support at 4.4 and a move below this level would negate the head-and-shoulders pattern. |
Arthur Hill is currently editor of TDTrader.com, a website specializing in trading strategies, sector/industry specific breadth stats and overall technical analysis. He passed the Society of Technical Analysts (STA London) diploma exam with distinction is a Certified Financial Technician (CFTe). Prior to TD Trader, he was the Chief Technical Analyst for Stockcharts.com and the main contributor to the ChartSchool.
| Title: | Editor |
| Company: | TDTrader.com |
| Address: | Willem Geetsstraat 17 |
| Mechelen, B2800 | |
| Phone # for sales: | 3215345465 |
| Website: | www.tdtrader.com |
| E-mail address: | arthurh@tdtrader.com |
Traders' Resource Links | |
| TDTrader.com has not added any product or service information to TRADERS' RESOURCE. | |
Click here for more information about our publications!
Comments
Date: 06/01/05Rank: 5Comment:

Request Information From Our Sponsors
- VectorVest, Inc.
- Executive Premier Workshop
- One-Day Options Course
- OptionsPro
- Retirement Income Workshop
- Sure-Fire Trading Systems (VectorVest, Inc.)
- Trading as a Business Workshop
- VectorVest 7 EOD
- VectorVest 7 RealTime/IntraDay
- VectorVest AutoTester
- VectorVest Educational Services
- VectorVest OnLine
- VectorVest Options Analyzer
- VectorVest ProGraphics v6.0
- VectorVest ProTrader 7
- VectorVest RealTime Derby Tool
- VectorVest Simulator
- VectorVest Variator
- VectorVest Watchdog
- StockCharts.com, Inc.
- Candle Patterns
- Candlestick Charting Explained
- Intermarket Technical Analysis
- John Murphy on Chart Analysis
- John Murphy's Chart Pattern Recognition
- John Murphy's Market Message
- MurphyExplainsMarketAnalysis-Intermarket Analysis
- MurphyExplainsMarketAnalysis-Visual Analysis
- StockCharts.com
- Technical Analysis of the Financial Markets
- The Visual Investor
