HOT TOPICS LIST
- MACD
- Fibonacci
- RSI
- Gann
- ADXR
- Stochastics
- Volume
- Triangles
- Futures
- Cycles
- Volatility
- ZIGZAG
- MESA
- Retracement
- Aroon
INDICATORS LIST
LIST OF TOPICS
PRINT THIS ARTICLE
by Gary Grosschadl
After suffering a big decline from the highs of last November, the Philadelphia gold & silver index is showing signs of another bounce.
Position: Buy
Gary Grosschadl
Independent Canadian equities trader and technical analyst based in Peterborough
Ontario, Canada.
PRINT THIS ARTICLE
CHART ANALYSIS
Gold Index Bouncing
06/01/05 08:07:31 AMby Gary Grosschadl
After suffering a big decline from the highs of last November, the Philadelphia gold & silver index is showing signs of another bounce.
Position: Buy
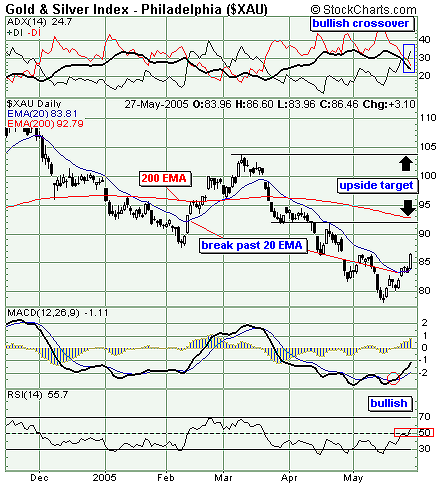
| As the daily chart (Figure 1) shows, the previous rally was only a bear rally that failed with a shooting star top last March. Whether this is another failure move remains to be seen. |
| When a stock or index endures a lengthy decline, a hallmark is stiff resistance to the 20-period moving average. In this case, this is clearly shown by the 20-day exponential moving average (EMA). Note the last rally was launched by a move past the 20-day EMA. Now we have a similar circumstance with the recent close above this EMA. |

|
| Figure 1: Daily chart of the XAU Gold Index shows a rally evolving. |
| Graphic provided by: StockCharts.com. |
| |
| Several indicators acknowledge this bullish promise. At the top of the chart, the components of the directional movement indicator (DMI) show a bullish crossover. When +DI rises above -DI, the bulls are wrestling control over bearish forces. The ideal bullish circumstance occurs when the average directional movement index (ADX) rises above 25; this may take some time if it occurs at all. The moving average convergence/divergence (MACD) shows its own bullish cross rising from very low levels with plenty of upside room. Finally, the relative strength index (RSI) has risen past its key area of the 50 level. Note the similarity to the previous rally of the 20-day EMA. |
| Two upside targets are indicated, depending on the strength of this move. The first target is the area of the often important 200-day EMA, which also relates to a previous congestion area. For a stronger move to evolve, we would need to see strength above this level. A pause here with support from the 200-day EMA could set up a bolder move to test previous highs at 104. A lasting turnaround would be marked with continued support from the 20-day EMA, something worth following should this turn out to be something more than just another bear rally. |
Independent Canadian equities trader and technical analyst based in Peterborough
Ontario, Canada.
| Website: | www.whatsonsale.ca/financial.html |
| E-mail address: | gwg7@sympatico.ca |
Click here for more information about our publications!
Comments
Date: 06/01/05Rank: 5Comment:
Date: 06/02/05Rank: 5Comment:
Date: 06/12/05Rank: 5Comment: yes usefull

Request Information From Our Sponsors
- StockCharts.com, Inc.
- Candle Patterns
- Candlestick Charting Explained
- Intermarket Technical Analysis
- John Murphy on Chart Analysis
- John Murphy's Chart Pattern Recognition
- John Murphy's Market Message
- MurphyExplainsMarketAnalysis-Intermarket Analysis
- MurphyExplainsMarketAnalysis-Visual Analysis
- StockCharts.com
- Technical Analysis of the Financial Markets
- The Visual Investor
- VectorVest, Inc.
- Executive Premier Workshop
- One-Day Options Course
- OptionsPro
- Retirement Income Workshop
- Sure-Fire Trading Systems (VectorVest, Inc.)
- Trading as a Business Workshop
- VectorVest 7 EOD
- VectorVest 7 RealTime/IntraDay
- VectorVest AutoTester
- VectorVest Educational Services
- VectorVest OnLine
- VectorVest Options Analyzer
- VectorVest ProGraphics v6.0
- VectorVest ProTrader 7
- VectorVest RealTime Derby Tool
- VectorVest Simulator
- VectorVest Variator
- VectorVest Watchdog
