HOT TOPICS LIST
- MACD
- Fibonacci
- RSI
- Gann
- ADXR
- Stochastics
- Volume
- Triangles
- Futures
- Cycles
- Volatility
- ZIGZAG
- MESA
- Retracement
- Aroon
INDICATORS LIST
LIST OF TOPICS
PRINT THIS ARTICLE
by David Penn
A new trend channel and a symmetrical triangle suggest opportunity in pharmaceutical stocks.
Position: N/A
David Penn
Technical Writer for Technical Analysis of STOCKS & COMMODITIES magazine, Working-Money.com, and Traders.com Advantage.
PRINT THIS ARTICLE
CHANNEL LINES
Triangles In Channels
05/31/05 01:52:32 PMby David Penn
A new trend channel and a symmetrical triangle suggest opportunity in pharmaceutical stocks.
Position: N/A
| Consider this: in September 2004, Merck announced a recall of its wildly popular, anti-arthritis drug Vioxx after tests suggested--among other things--there was the potential for the increased risk of heart problems for some who took the drug. |
| What do you think pharmaceutical stocks have been doing ever since? |

|
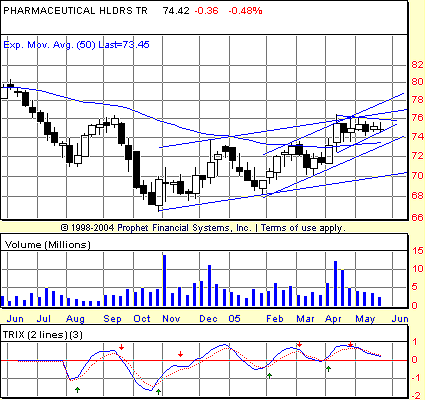
| Figure 1: Key resistance levels challenge PPH's ability to extend its rally from the October 2004 lows. |
| Graphic provided by: Prophet Financial, Inc. |
| |
| If there is something to the notion of a "stealth" bull market, then that sort of clandestine activity might be taking place in the pharmaceutical sector. Regardless of where we might find ourselves in the health care/stem cell debates taking place in the US right now, it cannot be denied that the message from vox populi is loud and clear: we want our medical science breakthroughs and we want them now! As reflected by the weekly chart of the pharmaceutical HOLDRS (PPH) in Figure 1, the stocks that represent these demands may be at a key inflection point. Note how the PPH has broken through a trend channel on an intraweek (that is, daily) basis. This trend channel represents the initial advance from the October bottom by PPH. A second, steeper trend channel can be drawn from the January lows. This channel has a number of confirmed touches in February and May. By April, the upper boundary of this newer trend channel was being tested, with volume becoming increasingly light. |

|
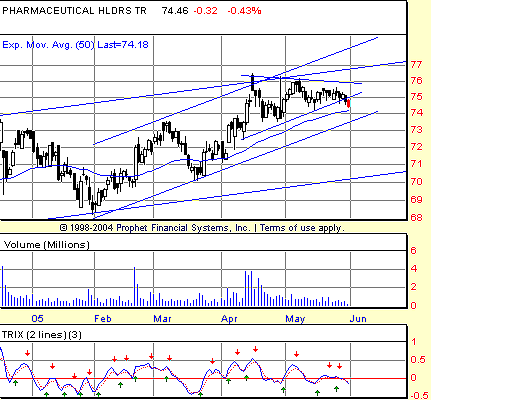
| Figure 2: The potential for a breakout to the upside from this daily symmetrical triangle grows weaker as prices begin to completely fill the pattern. |
| Graphic provided by: Prophet Financial, Inc. |
| |
| The consolidation from mid-April to late May has taken the form of a symmetrical triangle, as the daily chart (Figure 2) perhaps reveals better than the weekly chart. The 50-day exponential moving average (EMA) has provided sound support over the entire duration of the consolidation, as volume has become lighter. There is still plenty of room for the drug stocks to correct and still remain within their newest, more-steeply-inclined-and-therefore-more-bullish trend channel. And that is to say nothing of PPH's earlier trend channel, which, while not as ambitious as the newer channel, still consists of higher highs and higher lows on a weekly basis since late last year. |
| But the potential for a breakout on the daily and weekly charts is tantalizing for those who've already grown skeptical of the tech-led gains of the past six weeks and are already looking for the next rotation. If there is to be such a breakout from the symmetrical triangle--or from the older of the two trend channels, the upper boundary of which still contains the PPH rally to date--then it will have to come soon. This is because, at least from the perspective of the triangle, prices have already traveled fairly far down the pattern when, in fact, a breakout two-thirds of the way through the triangle is optimal. A breakdown from these levels--with the top of the old trend channel proving to be stiff resistance--would be no less decisive. This especially would be the case if the break arrived on a sizable increase in volume. In any event, be it upper or downer, traders and speculators looking for their fix of drug stock trading should soon know which kind of trip they'll be riding. |
Technical Writer for Technical Analysis of STOCKS & COMMODITIES magazine, Working-Money.com, and Traders.com Advantage.
| Title: | Technical Writer |
| Company: | Technical Analysis, Inc. |
| Address: | 4757 California Avenue SW |
| Seattle, WA 98116 | |
| Phone # for sales: | 206 938 0570 |
| Fax: | 206 938 1307 |
| Website: | www.Traders.com |
| E-mail address: | DPenn@traders.com |
Traders' Resource Links | |
| Charting the Stock Market: The Wyckoff Method -- Books | |
| Working-Money.com -- Online Trading Services | |
| Traders.com Advantage -- Online Trading Services | |
| Technical Analysis of Stocks & Commodities -- Publications and Newsletters | |
| Working Money, at Working-Money.com -- Publications and Newsletters | |
| Traders.com Advantage -- Publications and Newsletters | |
| Professional Traders Starter Kit -- Software | |
Click here for more information about our publications!
Comments
Date: 06/01/05Rank: 4Comment:

Request Information From Our Sponsors
- StockCharts.com, Inc.
- Candle Patterns
- Candlestick Charting Explained
- Intermarket Technical Analysis
- John Murphy on Chart Analysis
- John Murphy's Chart Pattern Recognition
- John Murphy's Market Message
- MurphyExplainsMarketAnalysis-Intermarket Analysis
- MurphyExplainsMarketAnalysis-Visual Analysis
- StockCharts.com
- Technical Analysis of the Financial Markets
- The Visual Investor
- VectorVest, Inc.
- Executive Premier Workshop
- One-Day Options Course
- OptionsPro
- Retirement Income Workshop
- Sure-Fire Trading Systems (VectorVest, Inc.)
- Trading as a Business Workshop
- VectorVest 7 EOD
- VectorVest 7 RealTime/IntraDay
- VectorVest AutoTester
- VectorVest Educational Services
- VectorVest OnLine
- VectorVest Options Analyzer
- VectorVest ProGraphics v6.0
- VectorVest ProTrader 7
- VectorVest RealTime Derby Tool
- VectorVest Simulator
- VectorVest Variator
- VectorVest Watchdog
