HOT TOPICS LIST
- MACD
- Fibonacci
- RSI
- Gann
- ADXR
- Stochastics
- Volume
- Triangles
- Futures
- Cycles
- Volatility
- ZIGZAG
- MESA
- Retracement
- Aroon
INDICATORS LIST
LIST OF TOPICS
PRINT THIS ARTICLE
by David Penn
The higher the May rally climbed, the lower the volume got.
Position: N/A
David Penn
Technical Writer for Technical Analysis of STOCKS & COMMODITIES magazine, Working-Money.com, and Traders.com Advantage.
PRINT THIS ARTICLE
VOLUME
Rallies On Weak Volume
05/31/05 01:26:56 PMby David Penn
The higher the May rally climbed, the lower the volume got.
Position: N/A
| It is always a good idea to pull back and take a longer-term view of the markets--especially when the calendar affords such an extended pause as the Memorial Day weekend, when end-of-day, end-of-week and (almost) end-of-month evaluations all can be made of recent price action. |
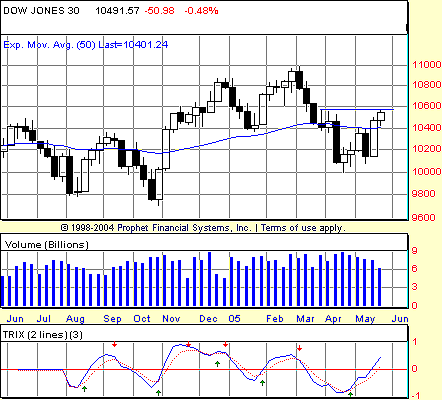
| I wrote about the Dow industrials and Dow transports recently ("Dow To The Moon!," Traders.com Advantage; May 31, 2005). Here, I want to take a closer look at the Dow industrials and the move they have made since bottoming in mid- to late April. Note in the weekly chart of the Dow 30 (Figure 1) that the TRIX indicator gave a buy signal as of April 29 (that is, the week beginning April 25). This buy signal has seen followthrough to the upside, so the general attitude toward the market should be bullish. |

|
| Figure 1: DJIA. Volume contracts as the Dow 30 rallies into potential resistance at the April highs. |
| Graphic provided by: Prophet Financial, Inc. |
| |
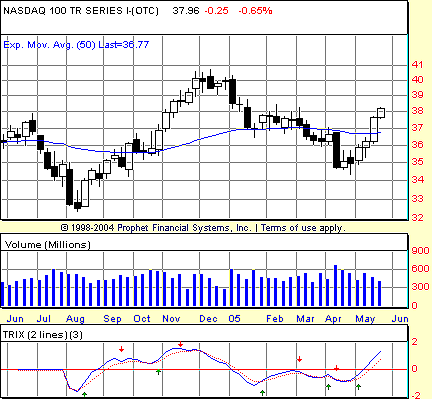
| The question is one of aggression. Just how bullish is the market right now? One reason the bulls might be better off impaling the picadors now instead of waiting around for the matador is the fact that the rally from the April bottom has moved higher on increasingly less volume. Were this a daily chart showing a declining volume trend into the end of May, then we might forgive the shallow volume by attributing it to a preholiday trading environment. However, the volume trend in the Dow 30 since the April bottom--as shown on the weekly chart--clearly shows that each week, the volume is lighter. This trend is not limited to the Dow 30. The NASDAQ 100, as represented by the QQQQ, is also showing declining volume trends on a weekly basis since bottoming in April. See Figure 2. |

|
| Figure 2: NASDAQ 100. The QQQQ also shows negative volume trends as it moves higher. |
| Graphic provided by: Prophet Financial, Inc. |
| |
| All that said, there is a reason why the phrase reads "price and volume" and not the other way around. While volume is indeed the fuel for price action, it is no less true that traders and speculators are "paid on price." By this, I mean that it is entirely possible for a market that has been rising on weak volume to continue to rise on weak volume. But it will be increasingly difficult for such a market to move beyond--for example, key resistance levels--if the volume trends do not change. |
| It is also worth noting--as the Japanese candlesticks help us do--that both the Dow 30 and the NASDAQ have been up for five of the past six weeks, including two in a row for the Dow and four in a row for the NASDAQ 100. Regardless of where it appears on a price chart, this kind of action in and of itself suggests the potential for pullback. And a pullback on low volume would be just the thing to provide the markets with the sort of pause that refreshes before setting out for another leg higher. |
Technical Writer for Technical Analysis of STOCKS & COMMODITIES magazine, Working-Money.com, and Traders.com Advantage.
| Title: | Technical Writer |
| Company: | Technical Analysis, Inc. |
| Address: | 4757 California Avenue SW |
| Seattle, WA 98116 | |
| Phone # for sales: | 206 938 0570 |
| Fax: | 206 938 1307 |
| Website: | www.Traders.com |
| E-mail address: | DPenn@traders.com |
Traders' Resource Links | |
| Charting the Stock Market: The Wyckoff Method -- Books | |
| Working-Money.com -- Online Trading Services | |
| Traders.com Advantage -- Online Trading Services | |
| Technical Analysis of Stocks & Commodities -- Publications and Newsletters | |
| Working Money, at Working-Money.com -- Publications and Newsletters | |
| Traders.com Advantage -- Publications and Newsletters | |
| Professional Traders Starter Kit -- Software | |
Click here for more information about our publications!
Comments
Date: 06/01/05Rank: 4Comment:
Date: 06/02/05Rank: 5Comment:

Request Information From Our Sponsors
- StockCharts.com, Inc.
- Candle Patterns
- Candlestick Charting Explained
- Intermarket Technical Analysis
- John Murphy on Chart Analysis
- John Murphy's Chart Pattern Recognition
- John Murphy's Market Message
- MurphyExplainsMarketAnalysis-Intermarket Analysis
- MurphyExplainsMarketAnalysis-Visual Analysis
- StockCharts.com
- Technical Analysis of the Financial Markets
- The Visual Investor
- VectorVest, Inc.
- Executive Premier Workshop
- One-Day Options Course
- OptionsPro
- Retirement Income Workshop
- Sure-Fire Trading Systems (VectorVest, Inc.)
- Trading as a Business Workshop
- VectorVest 7 EOD
- VectorVest 7 RealTime/IntraDay
- VectorVest AutoTester
- VectorVest Educational Services
- VectorVest OnLine
- VectorVest Options Analyzer
- VectorVest ProGraphics v6.0
- VectorVest ProTrader 7
- VectorVest RealTime Derby Tool
- VectorVest Simulator
- VectorVest Variator
- VectorVest Watchdog
