HOT TOPICS LIST
- MACD
- Fibonacci
- RSI
- Gann
- ADXR
- Stochastics
- Volume
- Triangles
- Futures
- Cycles
- Volatility
- ZIGZAG
- MESA
- Retracement
- Aroon
INDICATORS LIST
LIST OF TOPICS
PRINT THIS ARTICLE
by Arthur Hill
Millennium has been in the dog house since January 2004, but some key volume indicators show buying pressure over the last three months.
Position: Accumulate
Arthur Hill
Arthur Hill is currently editor of TDTrader.com, a website specializing in trading strategies, sector/industry specific breadth stats and overall technical analysis. He passed the Society of Technical Analysts (STA London) diploma exam with distinction is a Certified Financial Technician (CFTe). Prior to TD Trader, he was the Chief Technical Analyst for Stockcharts.com and the main contributor to the ChartSchool.
PRINT THIS ARTICLE
VOLUME
Signs Of Accumulation In Millennium
05/31/05 09:47:39 AMby Arthur Hill
Millennium has been in the dog house since January 2004, but some key volume indicators show buying pressure over the last three months.
Position: Accumulate
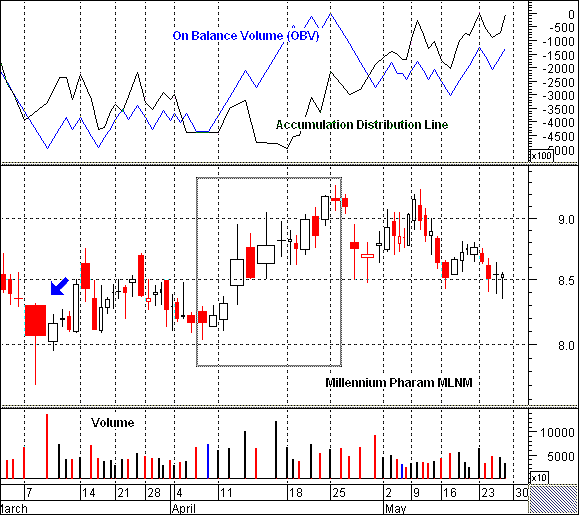
| The first indicator is candle volume. The width of the candlestick reflects the volume. High-volume days are wider than low volume days. The color of the candlestick reflects the change from day to day. Red candlesticks show a net loss on the day and black candlesticks show a net gain. Stocks that show accumulation should sport wide black candlesticks and thin red candlesticks. |
| The widest candlestick is red and formed on March 8 (blue arrow). This certainly shows selling pressure on high volume, but also marks a capitulation. The candlestick formed a long lower shadow (intraday low) and marked a three-month low. The high volume indicates a selling climax, and this low held again in early April. |

|
| Figure 1: Millennium |
| Graphic provided by: MetaStock. |
| Graphic provided by: Reuters Data. |
| |
| The advance in early April occurred on expanding upside volume. There are a number of wide black candlesticks in April (gray box), and these all occurred on relatively high volume. The stock peaked on April 26 and the decline over the last few weeks occurred on lower volume than the prior advance. Less volume on the downside shows weaker selling pressure. |
| And finally, two key volume indicators confirm candle volume as the accumulation-distribution line and on-balance volume (OBV) moved higher over the last few weeks. OBV bottomed in early April and formed a higher low in May. The accumulation-distribution line bottomed in mid-April and moved to a new high for 2005. Something is happening here, and traders should look for a break above the late April high for confirmation. |
Arthur Hill is currently editor of TDTrader.com, a website specializing in trading strategies, sector/industry specific breadth stats and overall technical analysis. He passed the Society of Technical Analysts (STA London) diploma exam with distinction is a Certified Financial Technician (CFTe). Prior to TD Trader, he was the Chief Technical Analyst for Stockcharts.com and the main contributor to the ChartSchool.
| Title: | Editor |
| Company: | TDTrader.com |
| Address: | Willem Geetsstraat 17 |
| Mechelen, B2800 | |
| Phone # for sales: | 3215345465 |
| Website: | www.tdtrader.com |
| E-mail address: | arthurh@tdtrader.com |
Traders' Resource Links | |
| TDTrader.com has not added any product or service information to TRADERS' RESOURCE. | |
Click here for more information about our publications!
Comments
Date: 05/31/05Rank: 4Comment:
Date: 06/01/05Rank: 5Comment:

Request Information From Our Sponsors
- StockCharts.com, Inc.
- Candle Patterns
- Candlestick Charting Explained
- Intermarket Technical Analysis
- John Murphy on Chart Analysis
- John Murphy's Chart Pattern Recognition
- John Murphy's Market Message
- MurphyExplainsMarketAnalysis-Intermarket Analysis
- MurphyExplainsMarketAnalysis-Visual Analysis
- StockCharts.com
- Technical Analysis of the Financial Markets
- The Visual Investor
- VectorVest, Inc.
- Executive Premier Workshop
- One-Day Options Course
- OptionsPro
- Retirement Income Workshop
- Sure-Fire Trading Systems (VectorVest, Inc.)
- Trading as a Business Workshop
- VectorVest 7 EOD
- VectorVest 7 RealTime/IntraDay
- VectorVest AutoTester
- VectorVest Educational Services
- VectorVest OnLine
- VectorVest Options Analyzer
- VectorVest ProGraphics v6.0
- VectorVest ProTrader 7
- VectorVest RealTime Derby Tool
- VectorVest Simulator
- VectorVest Variator
- VectorVest Watchdog
