HOT TOPICS LIST
- MACD
- Fibonacci
- RSI
- Gann
- ADXR
- Stochastics
- Volume
- Triangles
- Futures
- Cycles
- Volatility
- ZIGZAG
- MESA
- Retracement
- Aroon
INDICATORS LIST
LIST OF TOPICS
PRINT THIS ARTICLE
by Paolo Pezzutti
This short-term pattern provides good trading opportunities.
Position: N/A
Paolo Pezzutti
Author of the book "Trading the US Markets - A Comprehensive Guide to US Markets for International Traders and Investors" - Harriman House (July 2008)
PRINT THIS ARTICLE
Larry Williams And The OOPS Signal
05/31/05 12:19:20 PMby Paolo Pezzutti
This short-term pattern provides good trading opportunities.
Position: N/A
| Larry Williams published a description of a short-term trading method in 1979, a valuable one that is based on a pattern observed often in markets. The methodology was presented in his book, How I Made One Million Dollars Trading Commodities. It is still used by many traders with varying adaptations. The OOPS signal is a gap trading method that fades the direction of the opening gap. It is named thus, according to Williams, because when a broker would report to his clients that they were stopped out, he would call them and say, "Oops, we lost." |
The rules are:
|
|
| Entering in the opposite direction of the gap is based on a sentiment change in the market. If that does not happen, a trend day will occur and the market would gap and run. You would have professionals to cover their positions, summing up with the crowd's fresh money in a volatile and directional environment: a trend day! The OOPS signal is based on a psychological component. On the news or event, the market gaps in one direction, but there is no momentum and followthrough action, so prices reverse. If a trader gets suckered into bullish news and buys, once the market heads lower, he would sell that position. That is the force that drives prices to move lower. Consider also that most of the time the opening price will be near the high or low of the day 80% of the time. The OOPS provides, therefore, an excellent risk/reward ratio. |

|
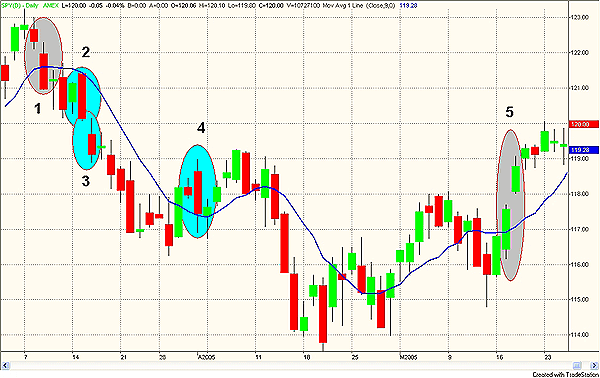
| Figure 1: SPY. Here's the OOPS setup in the SPY daily chart. |
| Graphic provided by: TradeStation. |
| |
Let's see some examples in Figure 1:
The pattern has its validity and its statistical value. Using OOPS, you can get significant gains from fading the gap. Often, when the trade goes in your direction, you have a trend day with nice profits. The results of the pattern depend at least on money management and stop-loss rules. However, it is not a mechanical system. You can have fun trying to figure out in which conditions OOPS works best. |
Author of the book "Trading the US Markets - A Comprehensive Guide to US Markets for International Traders and Investors" - Harriman House (July 2008)
| Address: | VIA ROBERTO AGO 26 POSTAL CODE 00166 |
| Rome, ITALY | |
| Phone # for sales: | +393357540708 |
| E-mail address: | pezzutti.paolo@tiscali.it |
Click here for more information about our publications!
Comments
Date: 05/31/05Rank: 4Comment:
Date: 05/31/05Rank: 5Comment:
Date: 06/01/05Rank: 5Comment:
Date: 12/21/22Rank: 4Comment:

Request Information From Our Sponsors
- StockCharts.com, Inc.
- Candle Patterns
- Candlestick Charting Explained
- Intermarket Technical Analysis
- John Murphy on Chart Analysis
- John Murphy's Chart Pattern Recognition
- John Murphy's Market Message
- MurphyExplainsMarketAnalysis-Intermarket Analysis
- MurphyExplainsMarketAnalysis-Visual Analysis
- StockCharts.com
- Technical Analysis of the Financial Markets
- The Visual Investor
- VectorVest, Inc.
- Executive Premier Workshop
- One-Day Options Course
- OptionsPro
- Retirement Income Workshop
- Sure-Fire Trading Systems (VectorVest, Inc.)
- Trading as a Business Workshop
- VectorVest 7 EOD
- VectorVest 7 RealTime/IntraDay
- VectorVest AutoTester
- VectorVest Educational Services
- VectorVest OnLine
- VectorVest Options Analyzer
- VectorVest ProGraphics v6.0
- VectorVest ProTrader 7
- VectorVest RealTime Derby Tool
- VectorVest Simulator
- VectorVest Variator
- VectorVest Watchdog
