HOT TOPICS LIST
- MACD
- Fibonacci
- RSI
- Gann
- ADXR
- Stochastics
- Volume
- Triangles
- Futures
- Cycles
- Volatility
- ZIGZAG
- MESA
- Retracement
- Aroon
INDICATORS LIST
LIST OF TOPICS
PRINT THIS ARTICLE
by David Penn
A negative stochastic divergence and a TRIX buy signal show the way higher in July corn.
Position: N/A
David Penn
Technical Writer for Technical Analysis of STOCKS & COMMODITIES magazine, Working-Money.com, and Traders.com Advantage.
PRINT THIS ARTICLE
TRIX
Up Popped Corn
05/27/05 08:05:37 AMby David Penn
A negative stochastic divergence and a TRIX buy signal show the way higher in July corn.
Position: N/A
| Sometimes when the markets are moving up, it seems as if they are all moving up. So much time has been spent focusing at the advances in stocks over the past few weeks (especially technology stocks) that some of the other assets out there--from currencies to futures--have been relatively overlooked. |
| To a degree, this is understandable (check out a chart of Intel!). But the obviousness of strength in technology stocks right now shouldn't be a blinder to the possibility of opportunities in other sectors, or in other markets altogether. |

|
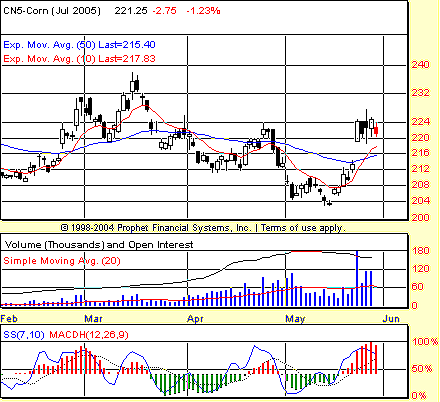
| Figure 1: A positive stochastic divergence in mid-May signals the potential for upside in July cotton. |
| Graphic provided by: Prophet Financial, Inc. |
| |
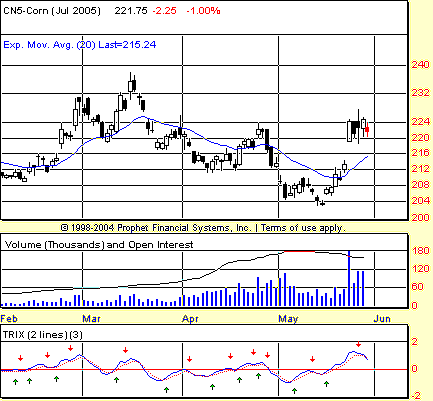
| For those open to trading or speculating in futures, the July corn contract might provide a small example (Figure 1). July corn put in a significant low in mid-May, at approximately the same time that many a tech stock was making a fakeout/shakeout move designed to dislodge weak longs from their shares. And just as technology stocks promptly reversed and headed higher, so did the prices of July corn. Note how July corn made a low in early May, and then followed that low with a lower low in mid-month. This series of lower lows in price was matched by a series of higher lows in the 7,10 stochastic, shown in blue in the lowermost panel. This sort of positive divergence often signals that further downside is limited, and that the opportunity for a reversal to the upside exists. Not only does the moving average convergence/divergence histogram (or MACDH) also display a positive divergence, but also the TRIX indicator--developed decades ago by Jack Hutson, founder and publisher of Technical Analysis, Inc.--is similarly providing a buy signal, as shown in Figure 2 by the green up arrow below the price/indicator action on May 16. |

|
| Figure 2: Red and green arrows--by noting where the two TRIX lines cross--make even clearer what the TRIX already makes plain in mid-May: a buying opportunity in July cotton. The last red arrow suggests an exit or even a short-selling opportunity if prices follow through to the downside. |
| Graphic provided by: Prophet Financial, Inc. |
| |
| Using May 16 as our signal day, we can look at a prospective swing trade as supported both by the stochastic/MACDH approach and provided by the TRIX. May 16 as a signal day gives me a "point" (that is, target entry price) of about 208.38 (round up to 208 %BD). This again comes from taking half the range of the signal bar and adding it to the high. This point is hit on May 18, on a day that closes with the trade in the money by a few cents. |
| July corn continued to move up sharply from this entry. A pure trailing stop would have forced an exit from the trade at around 220 %BC for nearly a 12-cent gain in about five or six days. A more liberal trailing stop would still have the trader in the trade as of this writing. And just like the best swing trades, there is no time during the trade that the position is underwater. |
Technical Writer for Technical Analysis of STOCKS & COMMODITIES magazine, Working-Money.com, and Traders.com Advantage.
| Title: | Technical Writer |
| Company: | Technical Analysis, Inc. |
| Address: | 4757 California Avenue SW |
| Seattle, WA 98116 | |
| Phone # for sales: | 206 938 0570 |
| Fax: | 206 938 1307 |
| Website: | www.Traders.com |
| E-mail address: | DPenn@traders.com |
Traders' Resource Links | |
| Charting the Stock Market: The Wyckoff Method -- Books | |
| Working-Money.com -- Online Trading Services | |
| Traders.com Advantage -- Online Trading Services | |
| Technical Analysis of Stocks & Commodities -- Publications and Newsletters | |
| Working Money, at Working-Money.com -- Publications and Newsletters | |
| Traders.com Advantage -- Publications and Newsletters | |
| Professional Traders Starter Kit -- Software | |
Click here for more information about our publications!
Comments
Date: 05/29/05Rank: 2Comment:

Request Information From Our Sponsors
- StockCharts.com, Inc.
- Candle Patterns
- Candlestick Charting Explained
- Intermarket Technical Analysis
- John Murphy on Chart Analysis
- John Murphy's Chart Pattern Recognition
- John Murphy's Market Message
- MurphyExplainsMarketAnalysis-Intermarket Analysis
- MurphyExplainsMarketAnalysis-Visual Analysis
- StockCharts.com
- Technical Analysis of the Financial Markets
- The Visual Investor
- VectorVest, Inc.
- Executive Premier Workshop
- One-Day Options Course
- OptionsPro
- Retirement Income Workshop
- Sure-Fire Trading Systems (VectorVest, Inc.)
- Trading as a Business Workshop
- VectorVest 7 EOD
- VectorVest 7 RealTime/IntraDay
- VectorVest AutoTester
- VectorVest Educational Services
- VectorVest OnLine
- VectorVest Options Analyzer
- VectorVest ProGraphics v6.0
- VectorVest ProTrader 7
- VectorVest RealTime Derby Tool
- VectorVest Simulator
- VectorVest Variator
- VectorVest Watchdog
