HOT TOPICS LIST
- MACD
- Fibonacci
- RSI
- Gann
- ADXR
- Stochastics
- Volume
- Triangles
- Futures
- Cycles
- Volatility
- ZIGZAG
- MESA
- Retracement
- Aroon
INDICATORS LIST
LIST OF TOPICS
PRINT THIS ARTICLE
by Ashwani Gujral
After an extended period of falls, Lifeway Foods went into a dull rounding bottoming process. The stock recently exploded on the upside on heavy volume, indicating that strong hands have been accumulating the stock in the past few months.
Position: Buy
Ashwani Gujral
He is founder of AGIP Securities Pvt. Ltd. which offers money management services, live chat rooms (during market hours) and independent technical analysis consultancy. The company has a big media presence from the likes of CNBC, NDTV Profit, and ZEE Business.
PRINT THIS ARTICLE
ROUND TOP & BOTTOM
Lifeway Foods Bottoms Out (Rounding Bottom)
05/27/05 09:49:48 AMby Ashwani Gujral
After an extended period of falls, Lifeway Foods went into a dull rounding bottoming process. The stock recently exploded on the upside on heavy volume, indicating that strong hands have been accumulating the stock in the past few months.
Position: Buy
| At a time when the major indexes in the market are going sideways, many stocks take this opportunity to make large bases and bottom out from prior drops. As the markets starts to break on the upside, these stocks explode on the upside with heavy volume and start bull trends. The key to trading these stocks is to enter them on the first available reaction and ride out the entire upside using a trailing stop. In addition, we'll discuss an irregular bullish head-and-shoulders pattern that provides an upside target as a reference. Again, it is key to understand that the exact semantics and shapes are not important, but the message that the pattern is conveying is. |

|
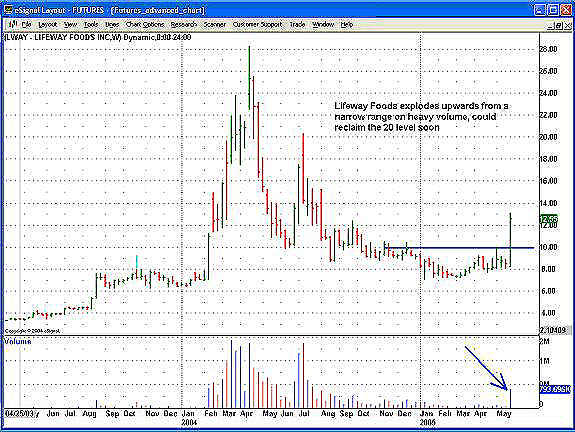
| Figure 1: LWAY Weekly Chart |
| Graphic provided by: eSignal. |
| |
| On the weekly chart of Lifeway (LWAY) (Figure 1), we see an explosive range breakout with heavy volumes. The key thing to watch is that the stock declined from higher levels and then went into a dull rounding bottom process and finally started moving up. Volume action is key; we can see that volume was high when the stock was being sold off. It tapered off as the stock went into a dull trading range and picked up again as the stock broke out again. Business anchors often ask if the stock has made a bottom at a certain price, and frankly, it is not an event but a process. As we can see, the volume picked up as the stock almost made a six-month high. A rough medium-term target of 20 on the weekly chart seems likely, as that is a key previous major intermediate top. |

|
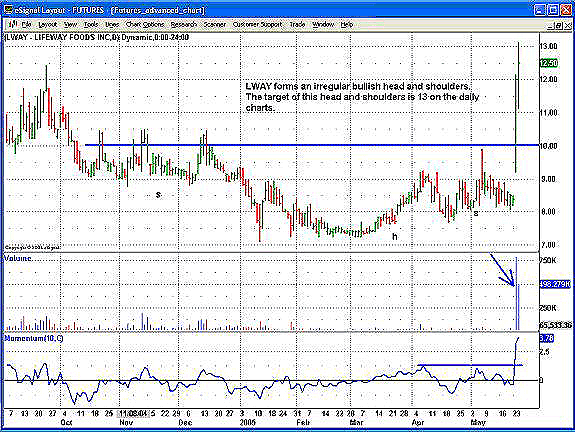
| Figure 2: LWAY Daily Chart |
| Graphic provided by: eSignal. |
| |
| On the daily chart (Figure 2), we see an irregular bullish head-and-shoulders pattern. This facilitates the expectation of a breakout that could be expected and also provides a short-term target of 13, which is the width of the pattern. As you can see, the left shoulder breakout occurs with heavy volume, which is a key condition of the bullish head-and-shoulders pattern. Another indicator that can be used is the momentum indicator. When a market moves in a narrow range, the momentum corrects to zero, and then breaks out in the direction of the breakout. High momentum and high volumes are both desirable conditions in case of upside action. |
| The key point I want to make is looking at the bottoming-out process of stock from a long-term and a short-term point of view. While pattern action is important on the weekly charts, momentum and volumes gain importance on the daily ones. |
He is founder of AGIP Securities Pvt. Ltd. which offers money management services, live chat rooms (during market hours) and independent technical analysis consultancy. The company has a big media presence from the likes of CNBC, NDTV Profit, and ZEE Business.
| Title: | Chief mkt strategist |
| Company: | AGIP Securities |
| India | |
| Phone # for sales: | 9871066337 |
| Website: | www.ashwanigujral.com |
| E-mail address: | contact@ashwanigujral.com |
Traders' Resource Links | |
| AGIP Securities has not added any product or service information to TRADERS' RESOURCE. | |
Click here for more information about our publications!
Comments
Date: 05/29/05Rank: 4Comment:

|

Request Information From Our Sponsors
- StockCharts.com, Inc.
- Candle Patterns
- Candlestick Charting Explained
- Intermarket Technical Analysis
- John Murphy on Chart Analysis
- John Murphy's Chart Pattern Recognition
- John Murphy's Market Message
- MurphyExplainsMarketAnalysis-Intermarket Analysis
- MurphyExplainsMarketAnalysis-Visual Analysis
- StockCharts.com
- Technical Analysis of the Financial Markets
- The Visual Investor
- VectorVest, Inc.
- Executive Premier Workshop
- One-Day Options Course
- OptionsPro
- Retirement Income Workshop
- Sure-Fire Trading Systems (VectorVest, Inc.)
- Trading as a Business Workshop
- VectorVest 7 EOD
- VectorVest 7 RealTime/IntraDay
- VectorVest AutoTester
- VectorVest Educational Services
- VectorVest OnLine
- VectorVest Options Analyzer
- VectorVest ProGraphics v6.0
- VectorVest ProTrader 7
- VectorVest RealTime Derby Tool
- VectorVest Simulator
- VectorVest Variator
- VectorVest Watchdog
