HOT TOPICS LIST
- MACD
- Fibonacci
- RSI
- Gann
- ADXR
- Stochastics
- Volume
- Triangles
- Futures
- Cycles
- Volatility
- ZIGZAG
- MESA
- Retracement
- Aroon
INDICATORS LIST
LIST OF TOPICS
PRINT THIS ARTICLE
by Ashwani Gujral
Crude oil seems to have completed its decline in the last few weeks in the shape of bullish wedge. It seems to have found support at $48. If it sustains the $51 level, it could head to the $61 level.
Position: Buy
Ashwani Gujral
He is founder of AGIP Securities Pvt. Ltd. which offers money management services, live chat rooms (during market hours) and independent technical analysis consultancy. The company has a big media presence from the likes of CNBC, NDTV Profit, and ZEE Business.
PRINT THIS ARTICLE
CHART ANALYSIS
Is Crude Starting Another Upmove? (Bullish Wedge)
05/27/05 09:46:58 AMby Ashwani Gujral
Crude oil seems to have completed its decline in the last few weeks in the shape of bullish wedge. It seems to have found support at $48. If it sustains the $51 level, it could head to the $61 level.
Position: Buy
| The price of crude is a key variable in the global growth projections. Similarily, a bullish wedge in an ongoing uptrend can be a key indicator of that trend continuing. A bullish wedge is a downward-sloping triangular formation in an uptrend. A sustained breakout above the upper line of this pattern indicates that the price has resumed its journey up. A key feature of the bullish wedge is that the range of the bars narrow and volume slows down as the bullish wedge is about to break out. |

|
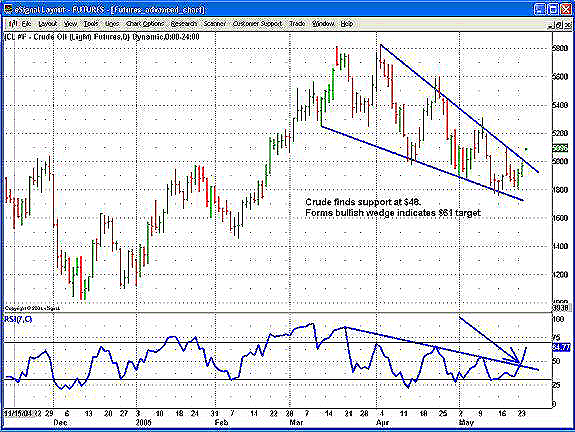
| Figure 1: Crude Oil Daily Chart |
| Graphic provided by: eSignal. |
| |
| On the daily chart (Figure 1), a bullish wedge is seen to be forming. The wedge takes support twice at the 48 level and then breaks above the upper boundary of the wedge. A measurement of the target is made by taking the previous significant rally, which here is $13.50 from the $44.50. Adding $13.50 to $48, a target of $61 is achieved. In addition, we can see the seven-day relative strength index (RSI) has given a trendline breakout. Taking both signals, it seems likely that crude will move higher. |

|
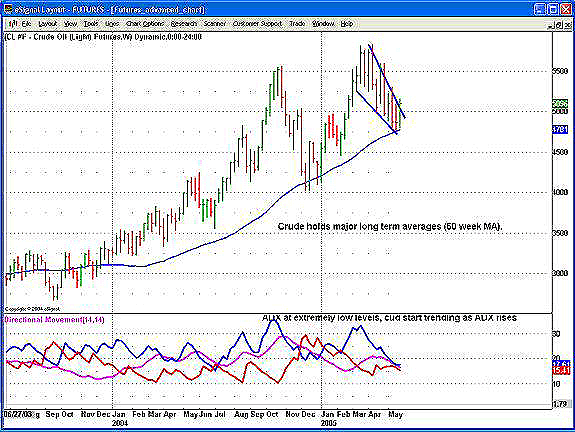
| Figure 2: Crude Oil Weekly Chart |
| Graphic provided by: eSignal. |
| |
| On the weekly chart (Figure 2), the same pattern is visible. A 50-week moving average is drawn on the chart to confirm the trend. It shows that crude has held all major supports in its decline and its long-term bull market is intact. A check of the average directional movement index (ADX) shows a value of 15.41, which shows the lack of a strong trend and small swings. As the ADX rises above 20, it will be key to watch a strong trend develop on the weekly chart, which may support the upmove further. |
He is founder of AGIP Securities Pvt. Ltd. which offers money management services, live chat rooms (during market hours) and independent technical analysis consultancy. The company has a big media presence from the likes of CNBC, NDTV Profit, and ZEE Business.
| Title: | Chief mkt strategist |
| Company: | AGIP Securities |
| India | |
| Phone # for sales: | 9871066337 |
| Website: | www.ashwanigujral.com |
| E-mail address: | contact@ashwanigujral.com |
Traders' Resource Links | |
| AGIP Securities has not added any product or service information to TRADERS' RESOURCE. | |
Click here for more information about our publications!
Comments
Date: 05/29/05Rank: 4Comment:
Date: 05/30/05Rank: 4Comment:
Date: 05/31/05Rank: 5Comment:
Date: 06/23/05Rank: 5Comment:

Request Information From Our Sponsors
- StockCharts.com, Inc.
- Candle Patterns
- Candlestick Charting Explained
- Intermarket Technical Analysis
- John Murphy on Chart Analysis
- John Murphy's Chart Pattern Recognition
- John Murphy's Market Message
- MurphyExplainsMarketAnalysis-Intermarket Analysis
- MurphyExplainsMarketAnalysis-Visual Analysis
- StockCharts.com
- Technical Analysis of the Financial Markets
- The Visual Investor
- VectorVest, Inc.
- Executive Premier Workshop
- One-Day Options Course
- OptionsPro
- Retirement Income Workshop
- Sure-Fire Trading Systems (VectorVest, Inc.)
- Trading as a Business Workshop
- VectorVest 7 EOD
- VectorVest 7 RealTime/IntraDay
- VectorVest AutoTester
- VectorVest Educational Services
- VectorVest OnLine
- VectorVest Options Analyzer
- VectorVest ProGraphics v6.0
- VectorVest ProTrader 7
- VectorVest RealTime Derby Tool
- VectorVest Simulator
- VectorVest Variator
- VectorVest Watchdog
