HOT TOPICS LIST
- MACD
- Fibonacci
- RSI
- Gann
- ADXR
- Stochastics
- Volume
- Triangles
- Futures
- Cycles
- Volatility
- ZIGZAG
- MESA
- Retracement
- Aroon
INDICATORS LIST
LIST OF TOPICS
PRINT THIS ARTICLE
by Ashwani Gujral
Infosys bottomed out on the daily chart, breaking out of a bullish head-and-shoulders pattern. On the weekly chart, it seems to be forming a bearish head and shoulders, unconfirmed as of yet. The weekly chart is defining a $60-80 range for the stock.
Position: Buy
Ashwani Gujral
He is founder of AGIP Securities Pvt. Ltd. which offers money management services, live chat rooms (during market hours) and independent technical analysis consultancy. The company has a big media presence from the likes of CNBC, NDTV Profit, and ZEE Business.
PRINT THIS ARTICLE
HEAD & SHOULDERS
Infosys Shows Conflicting Head-And-Shoulders Pattern On Daily And Weekly Charts
05/27/05 08:21:21 AMby Ashwani Gujral
Infosys bottomed out on the daily chart, breaking out of a bullish head-and-shoulders pattern. On the weekly chart, it seems to be forming a bearish head and shoulders, unconfirmed as of yet. The weekly chart is defining a $60-80 range for the stock.
Position: Buy
| A head-and-shoulders pattern is one of the most recognizable patterns on the technical charts. It either shows accumulation or distribution. A bullish head and shoulders consists of first a bottom and then a rally, a second lower bottom and again a rally to the previous pivot, and finally, a third higher bottom that breaks out of the two previous pivots on good volume. A bearish head and shoulders is the exact reverse. Targets for these patterns are determined by extrapolating the width of the pattern below or above the neckline, for bearish and bullish head and shoulders, respectively. A warning here is that trades should not be taken based on patterns that do not have confirmed breakouts yet because patterns can and do change shapes very often. |

|
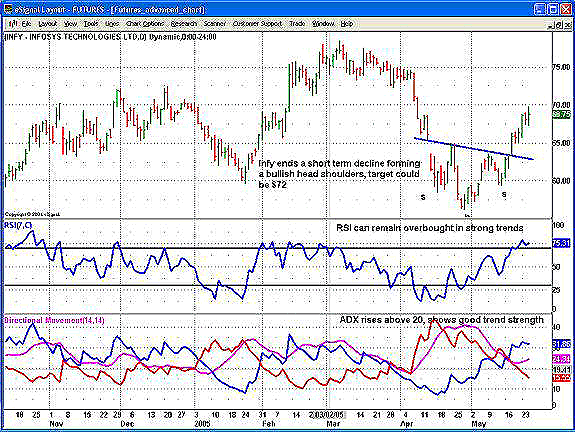
| Figure 1: Infosys Daily Chart |
| Graphic provided by: eSignal. |
| |
| On the daily chart (Figure 1), Infosys has formed a bullish head-and-shoulders pattern that has broken out above the $64 level where the neckline is situated. A target of $72 is determined by measuring the width of the pattern--$8 ($64-56)--and adding it to the $64 level. An uptrend was also confirmed by an overbought seven-day relative strength index (RSI) and a rising average directional movement index (ADX) above the 20 level. An overbought RSI in a trending market indicates bullishness, while an ADX rising above 20 shows a strong trend. |

|
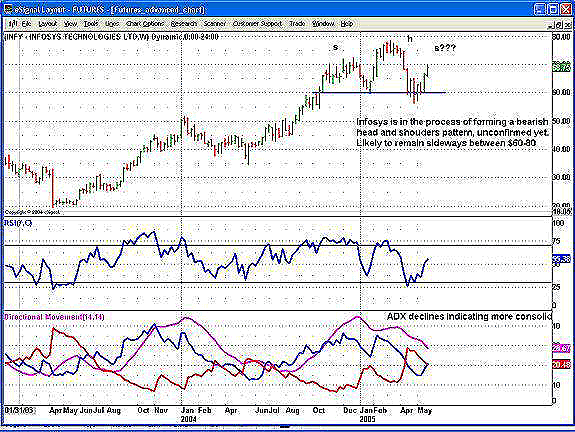
| Figure 2: Infosys Weekly Chart |
| Graphic provided by: eSignal. |
| |
| On the weekly chart (Figure 2), we see an unfinished pattern that seems to be taking the shape of bearish head-and-shoulders pattern. Since it has not been confirmed by a breakout, it can easily turn out to the consolidation. As a trader, I would assume this is a sideways consolidation unless confirmed breakdown below the neckline happens. The range seems to be $60-80. If a long trade is taken on the daily, partial profits can be booked at the $72 resistance and complete profits can be booked at the $80 level. The ADX shows consolidation as it declines, which further strengthens our premise that this pattern may end being a sideways consolidation. |
He is founder of AGIP Securities Pvt. Ltd. which offers money management services, live chat rooms (during market hours) and independent technical analysis consultancy. The company has a big media presence from the likes of CNBC, NDTV Profit, and ZEE Business.
| Title: | Chief mkt strategist |
| Company: | AGIP Securities |
| India | |
| Phone # for sales: | 9871066337 |
| Website: | www.ashwanigujral.com |
| E-mail address: | contact@ashwanigujral.com |
Traders' Resource Links | |
| AGIP Securities has not added any product or service information to TRADERS' RESOURCE. | |
Click here for more information about our publications!
Comments
Date: 05/27/05Rank: 4Comment:
Date: 05/28/05Rank: 5Comment:
Date: 03/31/07Rank: 3Comment:

Request Information From Our Sponsors
- StockCharts.com, Inc.
- Candle Patterns
- Candlestick Charting Explained
- Intermarket Technical Analysis
- John Murphy on Chart Analysis
- John Murphy's Chart Pattern Recognition
- John Murphy's Market Message
- MurphyExplainsMarketAnalysis-Intermarket Analysis
- MurphyExplainsMarketAnalysis-Visual Analysis
- StockCharts.com
- Technical Analysis of the Financial Markets
- The Visual Investor
- VectorVest, Inc.
- Executive Premier Workshop
- One-Day Options Course
- OptionsPro
- Retirement Income Workshop
- Sure-Fire Trading Systems (VectorVest, Inc.)
- Trading as a Business Workshop
- VectorVest 7 EOD
- VectorVest 7 RealTime/IntraDay
- VectorVest AutoTester
- VectorVest Educational Services
- VectorVest OnLine
- VectorVest Options Analyzer
- VectorVest ProGraphics v6.0
- VectorVest ProTrader 7
- VectorVest RealTime Derby Tool
- VectorVest Simulator
- VectorVest Variator
- VectorVest Watchdog
