HOT TOPICS LIST
- MACD
- Fibonacci
- RSI
- Gann
- ADXR
- Stochastics
- Volume
- Triangles
- Futures
- Cycles
- Volatility
- ZIGZAG
- MESA
- Retracement
- Aroon
INDICATORS LIST
LIST OF TOPICS
PRINT THIS ARTICLE
by Koos van der Merwe
With the price of oil appearing to settle at the $50 level, all companies involved in energy have come under the spotlight.
Position: Accumulate
Koos van der Merwe
Has been a technical analyst since 1969, and has worked as a futures and options trader with First Financial Futures in Johannesburg, South Africa.
PRINT THIS ARTICLE
MOVING AVERAGES
Applying The JM Strategy To Torrent Energy
05/26/05 07:45:41 AMby Koos van der Merwe
With the price of oil appearing to settle at the $50 level, all companies involved in energy have come under the spotlight.
Position: Accumulate
| Torrent Energy Corp. (TREN) is a Colorado-based energy company, committed to pursuing unconventional natural gas niche opportunities with primarily a North American focus. Torrent's wholly owned subsidiary, Methane Energy Corp., is an Oregon-based exploration company that is pioneering the exploration for natural gas contained in the coal bed seams of the Coos Bay Basin. The company currently has a land portfolio that includes 70,000 acres of highly prospective land in the Coos Bay area. |
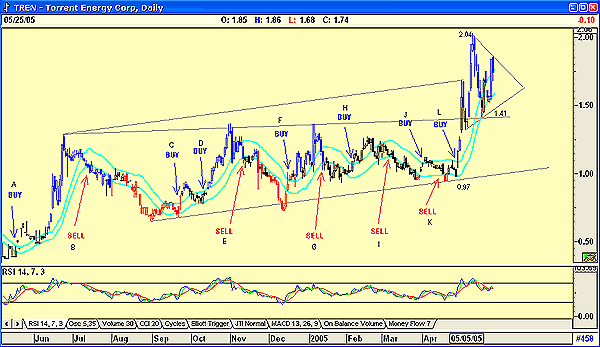
| I applied the JM strategy to determine buy and short levels (Figure 1). The strategy is a 15-period simple moving average, offset in this case by 5% and -5%. This forms an internal band where a buy signal is triggered when the price breaks above the upper band and a short signal when the price breaks below the lower band. An 8% stop-loss has been used in both instances as the exit strategy. |

|
| Figure 1: Torrent Energy. Here are the buy and short (sell) levels as the price broke above and below the JM band lines. |
| Graphic provided by: AdvancedGET. |
| |
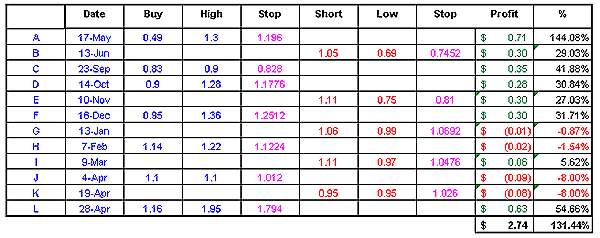
| In Figure 1, I show the buy and short (sell) levels as the price broke above and below the JM band lines. The spreadsheet shown in Figure 2 shows that following the JM strategy, using an 8% stop-loss would have given a profit of 131.44%. |

|
| Figure 2: Torrent Energy P/L. The spreadsheet shown shows that following the JM strategy, using an 8% stop-loss would have given a profit of 131.44%. |
| Graphic provided by: Excel Spreadsheet. |
| |
Do note that at the moment, you would not be holding the share, having been stopped out at $1.74 for a profit of 54.66%. A new buy signal has not been triggered, even though the price moved back above the upper JM band line, because the relative strength index (RSI) is suggesting weakness ahead. However, you would still be watching the share because a consolidation triangle is developing, where a break above the upper triangle's trendline would give a buy signal with a target price of $2.48. (2.04 - 0.97 = 1.07 + 1.41 = 2.48). We would therefore wait for the price to fall to the lower support line of the triangle, waiting for the RSI to give a buy signal, buying when:
|
| With the negative trending RSI signal, we would go short should the price break below the lower JM band line, although the resistance on the support line of the triangle may limit the profits made. A move below this support line with a negative trending RSI would be a strong sell signal. TREN would be a stock worth watching as long as the energy price remains high, using a strategy that has been very kind to us. |
Has been a technical analyst since 1969, and has worked as a futures and options trader with First Financial Futures in Johannesburg, South Africa.
| Address: | 3256 West 24th Ave |
| Vancouver, BC | |
| Phone # for sales: | 6042634214 |
| E-mail address: | petroosp@gmail.com |
Click here for more information about our publications!
Comments
Date: 05/26/05Rank: 4Comment:

Request Information From Our Sponsors
- VectorVest, Inc.
- Executive Premier Workshop
- One-Day Options Course
- OptionsPro
- Retirement Income Workshop
- Sure-Fire Trading Systems (VectorVest, Inc.)
- Trading as a Business Workshop
- VectorVest 7 EOD
- VectorVest 7 RealTime/IntraDay
- VectorVest AutoTester
- VectorVest Educational Services
- VectorVest OnLine
- VectorVest Options Analyzer
- VectorVest ProGraphics v6.0
- VectorVest ProTrader 7
- VectorVest RealTime Derby Tool
- VectorVest Simulator
- VectorVest Variator
- VectorVest Watchdog
- StockCharts.com, Inc.
- Candle Patterns
- Candlestick Charting Explained
- Intermarket Technical Analysis
- John Murphy on Chart Analysis
- John Murphy's Chart Pattern Recognition
- John Murphy's Market Message
- MurphyExplainsMarketAnalysis-Intermarket Analysis
- MurphyExplainsMarketAnalysis-Visual Analysis
- StockCharts.com
- Technical Analysis of the Financial Markets
- The Visual Investor
