HOT TOPICS LIST
- MACD
- Fibonacci
- RSI
- Gann
- ADXR
- Stochastics
- Volume
- Triangles
- Futures
- Cycles
- Volatility
- ZIGZAG
- MESA
- Retracement
- Aroon
INDICATORS LIST
LIST OF TOPICS
PRINT THIS ARTICLE
by Jayanthi Gopalakrishnan
One of the most powerful trading tools for the active trader is the Level II screen.
Position: N/A
Jayanthi Gopalakrishnan
PRINT THIS ARTICLE
Understanding Level II quotes - Part 1
07/07/00 01:03:34 PMby Jayanthi Gopalakrishnan
One of the most powerful trading tools for the active trader is the Level II screen.
Position: N/A
| The Nasdaq is considered a transparent market since Level II screens are accessible to the public. If you are armed with a Level II screen you can see what the market makers are doing, anticipate which direction prices are going to move, and try and trade in the direction of the market. |
| The Nasdaq consists of market makers who trade on behalf of their customers. Just like the specialist on the NYSE they too have to follow regulations. One is that they have to make available a two-sided market in any stock they are trading. This means that for every buy order they place, they have to have a corresponding sell order. Their quoted prices get posted on Level II screens, which they have to honor. They should also post the number of shares for their order. However, keep in mind that there are still some things that the market makers will not want you to know such as the volume's real level. So Level II screens may not give you the whole picture, but with experience you will be able to recognize certain factors that may be kept hidden from you. |

|
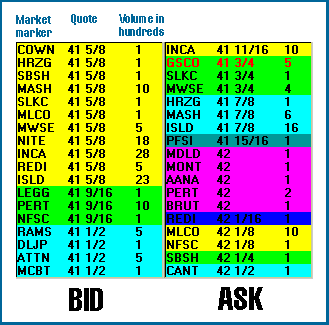
| The Level II screen enables you to watch the market makers and anticipate price movement, giving you an edge in making your trading decisions. |
| Graphic provided by: CyBerCorp, Inc.. |
| |
| If you look at the chart of the Level II screen of Broadvision, Inc. (BVSN) you will see two sections. The left-hand side is the bid (buy) side and the right-hand side lists the offers (ask/sell). Each market maker is identified by a unique symbol. Those listed on the left are interested in purchasing shares of BVSN and those on the right are interested in selling their shares. |
| The market makers are sorted in descending order with the highest bidder listed first. In this example, the highest bid is 41 5/8 and the highest offer (ask) is 41 11/16. The market makers quoting these prices are highlighted in yellow. The next lowest bid price is 41 9/16 and the next lowest offer (ask) is 41 3/4. These are displayed as green. These colors enable you to visually determine the action of the market makers. In this example, a larger yellow indicates that the buyers outnumber the sellers. In the second part of this series I will provide more details on using Level II screens. |
| Title: | Editor |
| Company: | Technical Analysis of Stocks & Commodities |
| Address: | 4757 California Ave SW |
| Seattle, WA 98116 | |
| Website: | Traders.com |
| E-mail address: | Jayanthi@traders.com |
Traders' Resource Links | |
| Charting the Stock Market: The Wyckoff Method -- Books | |
| Working-Money.com -- Online Trading Services | |
| Traders.com Advantage -- Online Trading Services | |
| Technical Analysis of Stocks & Commodities -- Publications and Newsletters | |
| Working Money, at Working-Money.com -- Publications and Newsletters | |
| Traders.com Advantage -- Publications and Newsletters | |
| Professional Traders Starter Kit -- Software | |
Click here for more information about our publications!
Comments
Date: / /Rank: 1Comment:

Request Information From Our Sponsors
- StockCharts.com, Inc.
- Candle Patterns
- Candlestick Charting Explained
- Intermarket Technical Analysis
- John Murphy on Chart Analysis
- John Murphy's Chart Pattern Recognition
- John Murphy's Market Message
- MurphyExplainsMarketAnalysis-Intermarket Analysis
- MurphyExplainsMarketAnalysis-Visual Analysis
- StockCharts.com
- Technical Analysis of the Financial Markets
- The Visual Investor
- VectorVest, Inc.
- Executive Premier Workshop
- One-Day Options Course
- OptionsPro
- Retirement Income Workshop
- Sure-Fire Trading Systems (VectorVest, Inc.)
- Trading as a Business Workshop
- VectorVest 7 EOD
- VectorVest 7 RealTime/IntraDay
- VectorVest AutoTester
- VectorVest Educational Services
- VectorVest OnLine
- VectorVest Options Analyzer
- VectorVest ProGraphics v6.0
- VectorVest ProTrader 7
- VectorVest RealTime Derby Tool
- VectorVest Simulator
- VectorVest Variator
- VectorVest Watchdog
