HOT TOPICS LIST
- MACD
- Fibonacci
- RSI
- Gann
- ADXR
- Stochastics
- Volume
- Triangles
- Futures
- Cycles
- Volatility
- ZIGZAG
- MESA
- Retracement
- Aroon
INDICATORS LIST
LIST OF TOPICS
PRINT THIS ARTICLE
by Arthur Hill
The semiconductor HOLDRS is closing at the top of its 2005 range, and a reversal may be in the offing.
Position: Hold
Arthur Hill
Arthur Hill is currently editor of TDTrader.com, a website specializing in trading strategies, sector/industry specific breadth stats and overall technical analysis. He passed the Society of Technical Analysts (STA London) diploma exam with distinction is a Certified Financial Technician (CFTe). Prior to TD Trader, he was the Chief Technical Analyst for Stockcharts.com and the main contributor to the ChartSchool.
PRINT THIS ARTICLE
STOCHASTIC OSCILL
Semi HOLDRS Heading For A Whole Lot Of Resistance
05/25/05 08:04:25 AMby Arthur Hill
The semiconductor HOLDRS is closing at the top of its 2005 range, and a reversal may be in the offing.
Position: Hold
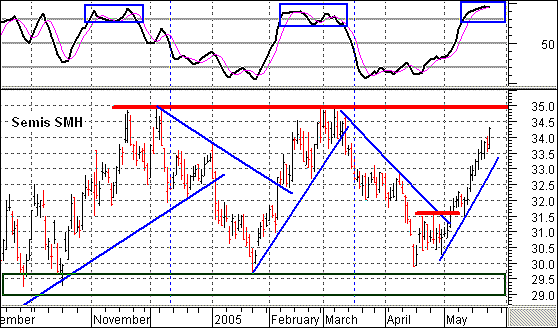
| The semiconductor HOLDRS (SMH) has traded between 29 and 35 since late September 2004. That makes for a 20% range that has extended for around eight months. The stock bounced off support in January and April this year and is currently headed toward resistance at 35 for at least the fifth time since November. |
| The blue trendlines define the swings within the trading range (Figure 1). The only way to really play such a pattern is buying near support and selling near resistance. However, some sort of reversal is needed to initiate a position. These trendlines did not pick the exact tops or bottoms, but managed to catch most of the swings. The current swing is up, and it would take a move below 33 to break the blue trendline extending up from late April. |

|
| Figure 1: Semi HOLDRS. The blue trendlines define the swings within the trading range. The current swing is up, and it would take a move below 33 to break the blue trendline extending up from late April. |
| Graphic provided by: MetaStock. |
| Graphic provided by: Reuters Data. |
| |
| In addition to trendlines, the stochastic oscillator can foreshadow reversals near resistance. The stochastic oscillator is trading above 80 and overbought. This already signals that bulls should tread carefully. The stochastic oscillator also became overbought in November-December and February-March. In each case, the stochastic oscillator moved above 80 twice before finally breaking down (blue boxes). In addition, note that the decline really took hold when the stochastic oscillator moved below 50 (blue dotted lines). |
| Currently, the stochastic oscillator is above 80 and remains above 80, showing strength. There was a lot of buying pressure over the last few weeks, and it may take a week or two to unwind. The previous reversals took a few weeks to unfold. I would look for the stock to consolidate near current levels, and the resolution of this consolidation will hold the key. A break above 35 would be bullish. A failure at 35 and a stochastic oscillator move below 50 would be bearish. |
Arthur Hill is currently editor of TDTrader.com, a website specializing in trading strategies, sector/industry specific breadth stats and overall technical analysis. He passed the Society of Technical Analysts (STA London) diploma exam with distinction is a Certified Financial Technician (CFTe). Prior to TD Trader, he was the Chief Technical Analyst for Stockcharts.com and the main contributor to the ChartSchool.
| Title: | Editor |
| Company: | TDTrader.com |
| Address: | Willem Geetsstraat 17 |
| Mechelen, B2800 | |
| Phone # for sales: | 3215345465 |
| Website: | www.tdtrader.com |
| E-mail address: | arthurh@tdtrader.com |
Traders' Resource Links | |
| TDTrader.com has not added any product or service information to TRADERS' RESOURCE. | |
Click here for more information about our publications!
Comments
Date: 05/25/05Rank: 5Comment:
Date: 05/26/05Rank: 4Comment:

Request Information From Our Sponsors
- StockCharts.com, Inc.
- Candle Patterns
- Candlestick Charting Explained
- Intermarket Technical Analysis
- John Murphy on Chart Analysis
- John Murphy's Chart Pattern Recognition
- John Murphy's Market Message
- MurphyExplainsMarketAnalysis-Intermarket Analysis
- MurphyExplainsMarketAnalysis-Visual Analysis
- StockCharts.com
- Technical Analysis of the Financial Markets
- The Visual Investor
- VectorVest, Inc.
- Executive Premier Workshop
- One-Day Options Course
- OptionsPro
- Retirement Income Workshop
- Sure-Fire Trading Systems (VectorVest, Inc.)
- Trading as a Business Workshop
- VectorVest 7 EOD
- VectorVest 7 RealTime/IntraDay
- VectorVest AutoTester
- VectorVest Educational Services
- VectorVest OnLine
- VectorVest Options Analyzer
- VectorVest ProGraphics v6.0
- VectorVest ProTrader 7
- VectorVest RealTime Derby Tool
- VectorVest Simulator
- VectorVest Variator
- VectorVest Watchdog
