HOT TOPICS LIST
- MACD
- Fibonacci
- RSI
- Gann
- ADXR
- Stochastics
- Volume
- Triangles
- Futures
- Cycles
- Volatility
- ZIGZAG
- MESA
- Retracement
- Aroon
INDICATORS LIST
LIST OF TOPICS
PRINT THIS ARTICLE
by David Penn
Do trendlines work? When markets are accommodating, trendlines--and their breaks--are as easy as 1-2-3.
Position: N/A
David Penn
Technical Writer for Technical Analysis of STOCKS & COMMODITIES magazine, Working-Money.com, and Traders.com Advantage.
PRINT THIS ARTICLE
REVERSAL
The OEX's 1-2-3 Trend Reversal
05/24/05 09:42:09 AMby David Penn
Do trendlines work? When markets are accommodating, trendlines--and their breaks--are as easy as 1-2-3.
Position: N/A
| There's a saying that there are no stupid questions. If that's true, then the oft-asked interrogative "Do trendlines work?" is a question that should be taken seriously. |
The initial step in determining whether trendlines work is to first establish what a trendline is. As far as I'm concerned, the best definition of a trendline comes from Victor Sperandeo in his book Trader Vic: Methods Of A Wall Street Master. After selecting the period to be considered, Sperandeo--using the example of a downtrend--encourages the following:Draw a line from the highest high point to the lowest minor high point preceding the lowest low so that the line does not pass through prices in between the two high points. Extend the line past the lowest high point downward. |

|
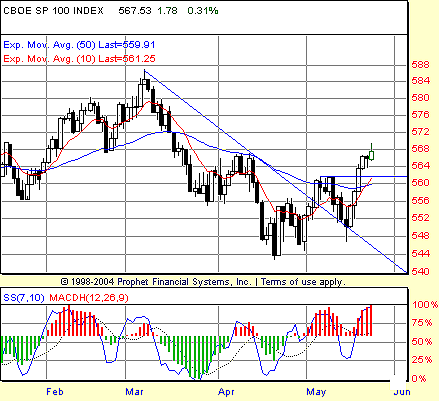
| Figure 1: A trendline break in early May is followed by a test to the downside and, shortly afterward, a rally back above the level of the initial trendline break. By midmonth, the trend reversal was on. |
| Graphic provided by: Prophet Financial, Inc. |
| |
| Figure 1 follows Sperandeo's trendline-drawing suggestions to a T. What is so important about drawing a good trendline (Sperandeo adds that his method, in addition to being "quite simple," has the additional virtues of being "extremely consistent and very accurate") is that trendline-based, trading setups that are always practical can be created because they are based on a consistent interpretation of what a trendline is. |
| The trendline-based, trading setup I'm referring to is also a product of Sperandeo's insights: the 1-2-3 trend reversal. I've written about the 1-2-3 trend reversal for Traders.com Advantage and Working Money, but thought that recent market action made for an especially apt time for revisiting the setup. Like Sperandeo's method for casting trendlines, the 1-2-3 trend reversal is also deceptively simple. The "1" in the 1-2-3 trend reversal setup refers to the trendline break itself. The "2" refers to the initial attempt to resume the previous trend before the move that forced a breaking of the trendline. So in the example above, "1" would have occurred on May 4 as prices smashed through the downtrend line; "2" would have occurred from May 10 through 13, as the $OEX attempted to reassert its downtrend. |
| Step "3" refers to the final stage of the trend reversal; "3" occurs when prices rally from the bottom established in "2" (following the example of a broken downtrend line) and move to take out the high established in "1." Again, referring to the example, "3" occurred and the 1-2-3 trend reversal was complete on May 18, when prices rallied to close above the high on May 5--when the intraday high of the "1" stage of the reversal was made. As Figure 1 shows, step 3 can also be considered a sort of breakout from the mid-April to mid-May consolidation. While volume for the $OEX is not shown, volume on that day in the NYSE and in the Dow Jones 30 was greater than it had been for several days. |
Technical Writer for Technical Analysis of STOCKS & COMMODITIES magazine, Working-Money.com, and Traders.com Advantage.
| Title: | Technical Writer |
| Company: | Technical Analysis, Inc. |
| Address: | 4757 California Avenue SW |
| Seattle, WA 98116 | |
| Phone # for sales: | 206 938 0570 |
| Fax: | 206 938 1307 |
| Website: | www.Traders.com |
| E-mail address: | DPenn@traders.com |
Traders' Resource Links | |
| Charting the Stock Market: The Wyckoff Method -- Books | |
| Working-Money.com -- Online Trading Services | |
| Traders.com Advantage -- Online Trading Services | |
| Technical Analysis of Stocks & Commodities -- Publications and Newsletters | |
| Working Money, at Working-Money.com -- Publications and Newsletters | |
| Traders.com Advantage -- Publications and Newsletters | |
| Professional Traders Starter Kit -- Software | |
Click here for more information about our publications!
Comments
Date: 05/24/05Rank: 3Comment:
Date: 05/25/05Rank: 5Comment:

Request Information From Our Sponsors
- StockCharts.com, Inc.
- Candle Patterns
- Candlestick Charting Explained
- Intermarket Technical Analysis
- John Murphy on Chart Analysis
- John Murphy's Chart Pattern Recognition
- John Murphy's Market Message
- MurphyExplainsMarketAnalysis-Intermarket Analysis
- MurphyExplainsMarketAnalysis-Visual Analysis
- StockCharts.com
- Technical Analysis of the Financial Markets
- The Visual Investor
- VectorVest, Inc.
- Executive Premier Workshop
- One-Day Options Course
- OptionsPro
- Retirement Income Workshop
- Sure-Fire Trading Systems (VectorVest, Inc.)
- Trading as a Business Workshop
- VectorVest 7 EOD
- VectorVest 7 RealTime/IntraDay
- VectorVest AutoTester
- VectorVest Educational Services
- VectorVest OnLine
- VectorVest Options Analyzer
- VectorVest ProGraphics v6.0
- VectorVest ProTrader 7
- VectorVest RealTime Derby Tool
- VectorVest Simulator
- VectorVest Variator
- VectorVest Watchdog
