

HOT TOPICS LIST
- MACD
- Fibonacci
- RSI
- Gann
- ADXR
- Stochastics
- Volume
- Triangles
- Futures
- Cycles
- Volatility
- ZIGZAG
- MESA
- Retracement
- Aroon
INDICATORS LIST
LIST OF TOPICS
PRINT THIS ARTICLE
by Arthur Hill
The long decline in the Amex Networking Index looks like a normal ABC correction that may have just ended.
Position: Accumulate
Arthur Hill
Arthur Hill is currently editor of TDTrader.com, a website specializing in trading strategies, sector/industry specific breadth stats and overall technical analysis. He passed the Society of Technical Analysts (STA London) diploma exam with distinction is a Certified Financial Technician (CFTe). Prior to TD Trader, he was the Chief Technical Analyst for Stockcharts.com and the main contributor to the ChartSchool.
PRINT THIS ARTICLE
ELLIOTT WAVE
Networking Index Traces out An ABC
05/23/05 10:05:33 AMby Arthur Hill
The long decline in the Amex Networking Index looks like a normal ABC correction that may have just ended.
Position: Accumulate
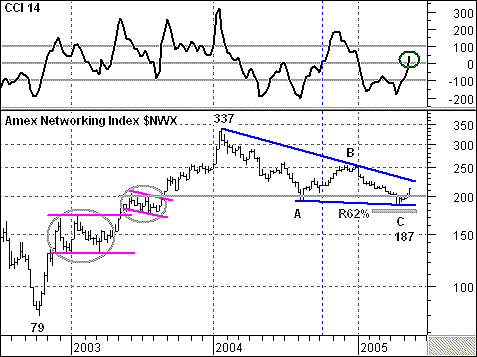
| On the weekly chart of the Amex Networking Index ($NWX) (Figure 1), the index advanced more than 300% from October 2002 to January 2004 (79 to 337). There were two relatively minor consolidations along the way (gray ovals), but no real correction or pullback. The advance was massive, and this allows for a large correction. A typical correction would retrace 50-62% of the prior advance, and the decline from 337 to 187 fits the bill so far. In addition, the decline has an Elliott ABC structure and is finding support around 200. |
|
| Figure 1: $NWX. On the weekly chart of the Amex Networking Index, the index advanced more than 300% from October 2002 to January 2004 (79 to 337). |
| Graphic provided by: MetaStock. |
| Graphic provided by: Reuters Data. |
| |
| This is a logical place for support and a bullish reversal, but a signal is required before turning bullish. I have applied the commodity channel index (CCI) to gauge momentum. In general, momentum favors the bulls when CCI is above zero (midpoint) and the bears when CCI is below zero. The indicator was below zero for most of 2005 and recently surged into positive territory for the first time since early January. This tells me that momentum is shifting toward the bulls and to prepare for more gains. In addition, note that CCI surged above zero in October 2004 and then led to further gains (blue dotted line). |
| Further strength is required to turn the actual price chart bullish. First, the index would need to break above the trendline extending down from 337. Second, the index would need to forge a higher high with a move above the December 2004 high (wave B). Currently, the index formed a lower low at 187 and remains in a downtrend. A move above the wave B high would signal a continuation of the October 2002 to January 2004 advance and project a move above the 337. |
Arthur Hill is currently editor of TDTrader.com, a website specializing in trading strategies, sector/industry specific breadth stats and overall technical analysis. He passed the Society of Technical Analysts (STA London) diploma exam with distinction is a Certified Financial Technician (CFTe). Prior to TD Trader, he was the Chief Technical Analyst for Stockcharts.com and the main contributor to the ChartSchool.
| Title: | Editor |
| Company: | TDTrader.com |
| Address: | Willem Geetsstraat 17 |
| Mechelen, B2800 | |
| Phone # for sales: | 3215345465 |
| Website: | www.tdtrader.com |
| E-mail address: | arthurh@tdtrader.com |
Traders' Resource Links | |
| TDTrader.com has not added any product or service information to TRADERS' RESOURCE. | |
Click here for more information about our publications!
Comments
Date:�05/23/05Rank:�3Comment:�

Request Information From Our Sponsors
- StockCharts.com, Inc.
- Candle Patterns
- Candlestick Charting Explained
- Intermarket Technical Analysis
- John Murphy on Chart Analysis
- John Murphy's Chart Pattern Recognition
- John Murphy's Market Message
- MurphyExplainsMarketAnalysis-Intermarket Analysis
- MurphyExplainsMarketAnalysis-Visual Analysis
- StockCharts.com
- Technical Analysis of the Financial Markets
- The Visual Investor
- VectorVest, Inc.
- Executive Premier Workshop
- One-Day Options Course
- OptionsPro
- Retirement Income Workshop
- Sure-Fire Trading Systems (VectorVest, Inc.)
- Trading as a Business Workshop
- VectorVest 7 EOD
- VectorVest 7 RealTime/IntraDay
- VectorVest AutoTester
- VectorVest Educational Services
- VectorVest OnLine
- VectorVest Options Analyzer
- VectorVest ProGraphics v6.0
- VectorVest ProTrader 7
- VectorVest RealTime Derby Tool
- VectorVest Simulator
- VectorVest Variator
- VectorVest Watchdog