HOT TOPICS LIST
- MACD
- Fibonacci
- RSI
- Gann
- ADXR
- Stochastics
- Volume
- Triangles
- Futures
- Cycles
- Volatility
- ZIGZAG
- MESA
- Retracement
- Aroon
INDICATORS LIST
LIST OF TOPICS
PRINT THIS ARTICLE
by Kevin Hopson
Market sentiment says a rebound in oil prices is likely.
Position: N/A
Kevin Hopson
Kevin has been a technical analyst for roughly 10 years now. Previously, Kevin owned his own business and acted as a registered investment advisor, specializing in energy. He was also a freelance oil analyst for Orient Trading Co., a commodity futures trading firm in Japan. Kevin is currently a freelance writer.
PRINT THIS ARTICLE
TECHNICAL INDICATORS
COT Trend Could Spell A Forthcoming Bottom In Crude Oil
05/23/05 09:57:09 AMby Kevin Hopson
Market sentiment says a rebound in oil prices is likely.
Position: N/A
| Each Friday, the Commodity Futures Trading Commission (CFTC) releases its weekly "Commitments of Traders" report, which shows the long and short positions for commercials and noncommercials as of the prior Tuesday. Commercials are those traders who have a physical stake in the underlying commodity (in this case, crude oil). Commercials include production companies, refiners, energy utilities, and so forth. Noncommercials, who tend to be the large hedge funds, do not have a physical stake in the commodity. Since commercials are in the oil business, they are considered to be the smart money (leading indicator). Meanwhile, noncommercials -- because of their speculative nature -- tend to be a lagging or contrarian indicator. |

|
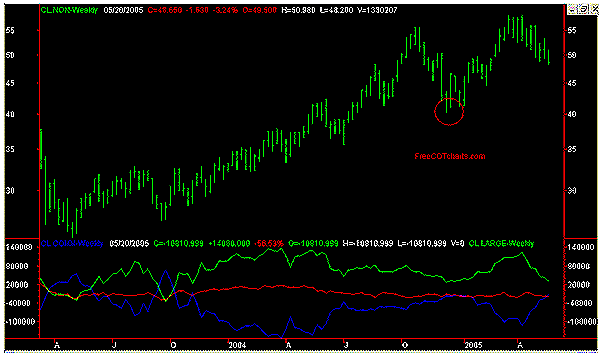
| Figure 1: Weekly chart for the COT noncommercials. Bottom of chart shows the noncommercials (green) vs. the commercials (blue). |
| Graphic provided by: FreeCOTcharts.com. |
| |
| As a result, the COT report can be a key gauge of market sentiment. For example, just six weeks ago, commercials had a net short position of 77,766 contracts. However, as of May 17, commercials had a net long position of 20,733 contracts. This means the smart money has been buying during the recent correction in crude oil prices. In the meantime, noncommercials have been doing just the opposite. More specifically, noncommercials have gone from a net long position of 88,712 contracts on April 5 to a net short position of 2,308 contracts on May 17. This is the first time that noncommercials have had a net short position since December 14, 2004. In addition, this is the largest net long position that commercials have had since December 14, 2004. |
| If you look at Figure 1, you will see the divergence between commercials (blue line) and noncommercials (green line) over the past six weeks. The last time commercial and noncommercial positions were at these levels (December 2004), crude oil prices proceeded to bottom out. This is illustrated by the red circle. In fact, prices rallied from $4 to $58 over the course of the next few months. As a result, I believe crude oil is close to putting in a bottom. In addition, prices could see a significant rally -- just like last year -- once the trend reverses. |
Kevin has been a technical analyst for roughly 10 years now. Previously, Kevin owned his own business and acted as a registered investment advisor, specializing in energy. He was also a freelance oil analyst for Orient Trading Co., a commodity futures trading firm in Japan. Kevin is currently a freelance writer.
| Glen Allen, VA | |
| E-mail address: | hopson_1@yahoo.com |
Click here for more information about our publications!
Comments
Date: 05/23/05Rank: 3Comment:

Request Information From Our Sponsors
- StockCharts.com, Inc.
- Candle Patterns
- Candlestick Charting Explained
- Intermarket Technical Analysis
- John Murphy on Chart Analysis
- John Murphy's Chart Pattern Recognition
- John Murphy's Market Message
- MurphyExplainsMarketAnalysis-Intermarket Analysis
- MurphyExplainsMarketAnalysis-Visual Analysis
- StockCharts.com
- Technical Analysis of the Financial Markets
- The Visual Investor
- VectorVest, Inc.
- Executive Premier Workshop
- One-Day Options Course
- OptionsPro
- Retirement Income Workshop
- Sure-Fire Trading Systems (VectorVest, Inc.)
- Trading as a Business Workshop
- VectorVest 7 EOD
- VectorVest 7 RealTime/IntraDay
- VectorVest AutoTester
- VectorVest Educational Services
- VectorVest OnLine
- VectorVest Options Analyzer
- VectorVest ProGraphics v6.0
- VectorVest ProTrader 7
- VectorVest RealTime Derby Tool
- VectorVest Simulator
- VectorVest Variator
- VectorVest Watchdog
