

HOT TOPICS LIST
- MACD
- Fibonacci
- RSI
- Gann
- ADXR
- Stochastics
- Volume
- Triangles
- Futures
- Cycles
- Volatility
- ZIGZAG
- MESA
- Retracement
- Aroon
INDICATORS LIST
LIST OF TOPICS
PRINT THIS ARTICLE
by Sean Moore
The weighted moving average places a greater importance on the most recent data and provides another twist to using moving average indicators in your analysis.
Position: Buy
Sean Moore
Traders.com Staff Writer.
PRINT THIS ARTICLE
WEIGHTED MA
Weighted Moving Averages
07/07/00 03:15:17 PMby Sean Moore
The weighted moving average places a greater importance on the most recent data and provides another twist to using moving average indicators in your analysis.
Position: Buy
| One of the most common technical indicators used to analyze the financial markets is the moving average. Moving averages are typically applied to a security's price data to help smooth volatility and remove some of the unnecessary fluctuations. | ||||||||||||||||||
| There are several different variations of moving averages that can be used in your analysis. One such variation is the linear weighted moving average (LMA). The LMA assigns weights to the data series so that the more recent data points have larger weights. For example, if you were applying an LMA to a price chart for a certain security, the most recent data would have the greatest influence on the LMA value, placing a greater importance on what is happening currently and less importance on what happened five or 10 days ago. By following actual prices more closely, the LMA typically has less lag than the other moving average variations (simple, exponential, triangular, etc.). The following formula is the most commonly used to compute the LMA: LMA = (1P1 + 2P2 + 3P3 +... + wnPn) / (1 + 2 + 3 +... + n) Where wn is the weight assigned on the n-th day and Pn is the price on the n-th day. The following table shows example data for calculating a 5-period LMA:
So, the LMA can be computed as: LMA = (1*35.5 + 2*37 + 3*38 + 4*37.25 + 5*36) / (1 + 2 + 3 + 4 + 5) LMA = 552.5 / 15 LMA = 36.83 | ||||||||||||||||||
| ||||||||||||||||||
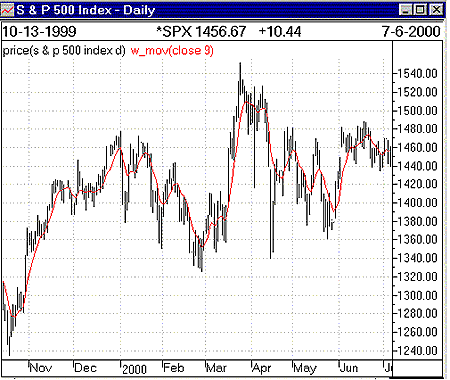
| Figure 1: Daily price chart for the S&P500 index plotted with a 9-day linear weighted moving average (red line). The price has just risen above the moving average line. | ||||||||||||||||||
| Graphic provided by: Window. | ||||||||||||||||||
| | ||||||||||||||||||
| Once the LMA is computed and plotted for an entire series of data, it can be used to generate buy and sell signals. A buy signal is generated when prices rise above the LMA line, and a sell signal is generated when the price falls below the LMA line. You can also look at the slope of the moving average line to gain a general understanding of the current trend. An upward slope helps signify rising prices, while a downward slope signifies declining prices. | ||||||||||||||||||
| Figure 1 shows the daily price chart for the S&P 500 Index plotted with a 9-day linear weighted moving average. As of July 6, 2000, the price for the S&P 500 has just risen above its weighted average line. Watch for a positive slope to form on this weighted average line to confirm the buy signal. | ||||||||||||||||||
| The linear weighted moving average is just one more variation to consider when conducting your next analysis. By placing a higher weight on the most current prices, the LMA can give stronger and earlier indications of trend direction. |
Traders.com Staff Writer.
| Title: | Project Engineer |
| Company: | Technical Analysis, Inc. |
| Address: | 4757 California Ave. SW |
| Seattle, WA 98116 | |
| Phone # for sales: | 206 938 0570 |
| Fax: | 206 938 1307 |
| Website: | Traders.com |
| E-mail address: | smoore@traders.com |
Traders' Resource Links | |
| Charting the Stock Market: The Wyckoff Method -- Books | |
| Working-Money.com -- Online Trading Services | |
| Traders.com Advantage -- Online Trading Services | |
| Technical Analysis of Stocks & Commodities -- Publications and Newsletters | |
| Working Money, at Working-Money.com -- Publications and Newsletters | |
| Traders.com Advantage -- Publications and Newsletters | |
| Professional Traders Starter Kit -- Software | |
Click here for more information about our publications!
Comments

Request Information From Our Sponsors
- StockCharts.com, Inc.
- Candle Patterns
- Candlestick Charting Explained
- Intermarket Technical Analysis
- John Murphy on Chart Analysis
- John Murphy's Chart Pattern Recognition
- John Murphy's Market Message
- MurphyExplainsMarketAnalysis-Intermarket Analysis
- MurphyExplainsMarketAnalysis-Visual Analysis
- StockCharts.com
- Technical Analysis of the Financial Markets
- The Visual Investor
- VectorVest, Inc.
- Executive Premier Workshop
- One-Day Options Course
- OptionsPro
- Retirement Income Workshop
- Sure-Fire Trading Systems (VectorVest, Inc.)
- Trading as a Business Workshop
- VectorVest 7 EOD
- VectorVest 7 RealTime/IntraDay
- VectorVest AutoTester
- VectorVest Educational Services
- VectorVest OnLine
- VectorVest Options Analyzer
- VectorVest ProGraphics v6.0
- VectorVest ProTrader 7
- VectorVest RealTime Derby Tool
- VectorVest Simulator
- VectorVest Variator
- VectorVest Watchdog