HOT TOPICS LIST
- MACD
- Fibonacci
- RSI
- Gann
- ADXR
- Stochastics
- Volume
- Triangles
- Futures
- Cycles
- Volatility
- ZIGZAG
- MESA
- Retracement
- Aroon
INDICATORS LIST
LIST OF TOPICS
PRINT THIS ARTICLE
by Koos van der Merwe
Icron Technologies Corp.'s patented ExtremeUSB technology extends the range of USB in wired environments and enables wireless USB to be used over any RF technology.
Position: Accumulate
Koos van der Merwe
Has been a technical analyst since 1969, and has worked as a futures and options trader with First Financial Futures in Johannesburg, South Africa.
PRINT THIS ARTICLE
FLAGS AND PENNANTS
A Cheapie In Icron
05/20/05 09:33:58 AMby Koos van der Merwe
Icron Technologies Corp.'s patented ExtremeUSB technology extends the range of USB in wired environments and enables wireless USB to be used over any RF technology.
Position: Accumulate
| Icron, after languishing for years between $0.16 and $0.50, has come alive and paid those investors who held on to the shares well, a reward for their patience and perseverance. It is the old story; if you trust the management and believe that they have a good product, then buy, accumulate, and hold. However, having written this, could technical analysis have timed the movement in the stock better than the buy and hold strategy? |
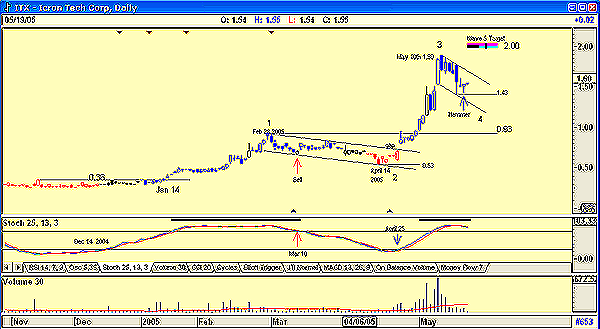
| The answer is decidedly "Yes," and Figure 1 shows it. The indicator I am using to time the movement of the share price is the stochastic oscillator, with the parameters 25,13. This stochastic gave a buy on December 14, 2004, when the share price was $0.36. Had you known the company, believed in the management, and ignored the nagging of the promoters, you would have waited until the indicator crossed the 20 line, as shown, before buying. On March 10, the indicator gave you a sell signal at a price of $0.67, giving you a profit of $0.31, a return of 86% over three months. Not bad, considering the fact that it took two years of watching the stock before your expectations were fulfilled. |

|
| Figure 1: Icron Technologies |
| Graphic provided by: AdvancedGET. |
| |
| The price then fell in a flag pattern, forming a low of $0.53 on April 14. The stochastic oscillator gave a buy on April 25, the day the price broke out of the flag on a gap. The price then moved up rapidly, reaching a high of $1.90 on May 10. Since then, it has fallen to $1.43 in what appears to be another flag pattern, which could once again trend into a lengthy process, as suggested by the stochastic. The indicator is oversold, but has not given a sell signal. You would have been stopped out of the share at $1.71 had you followed a 10% rising stop. |
| What now? The share price could rise to test the flag at $1.60 to $1.65 with the stochastic remaining overbought, but not giving a sell signal. An Elliott wave prediction shows that the current retracement is a wave 4, with a wave 5 target of $2.00, a target calculated by the "make or break" signal of AdvancedGET. Do note that on May 18, a hammer candlestick formed, suggesting a rally in the share price. You could take the risk of buying on the hammer formation, or you could be more cautious and wait for a break above the upper trendline of the flag. Volume is below average, suggesting strength as the share price fell. |
| This is a share that should be on your watchlist or, if you like the company and believe in the management, consider going for it. |
Has been a technical analyst since 1969, and has worked as a futures and options trader with First Financial Futures in Johannesburg, South Africa.
| Address: | 3256 West 24th Ave |
| Vancouver, BC | |
| Phone # for sales: | 6042634214 |
| E-mail address: | petroosp@gmail.com |
Click here for more information about our publications!
Comments
Date: 05/22/05Rank: 3Comment:

Request Information From Our Sponsors
- StockCharts.com, Inc.
- Candle Patterns
- Candlestick Charting Explained
- Intermarket Technical Analysis
- John Murphy on Chart Analysis
- John Murphy's Chart Pattern Recognition
- John Murphy's Market Message
- MurphyExplainsMarketAnalysis-Intermarket Analysis
- MurphyExplainsMarketAnalysis-Visual Analysis
- StockCharts.com
- Technical Analysis of the Financial Markets
- The Visual Investor
- VectorVest, Inc.
- Executive Premier Workshop
- One-Day Options Course
- OptionsPro
- Retirement Income Workshop
- Sure-Fire Trading Systems (VectorVest, Inc.)
- Trading as a Business Workshop
- VectorVest 7 EOD
- VectorVest 7 RealTime/IntraDay
- VectorVest AutoTester
- VectorVest Educational Services
- VectorVest OnLine
- VectorVest Options Analyzer
- VectorVest ProGraphics v6.0
- VectorVest ProTrader 7
- VectorVest RealTime Derby Tool
- VectorVest Simulator
- VectorVest Variator
- VectorVest Watchdog
