HOT TOPICS LIST
- MACD
- Fibonacci
- RSI
- Gann
- ADXR
- Stochastics
- Volume
- Triangles
- Futures
- Cycles
- Volatility
- ZIGZAG
- MESA
- Retracement
- Aroon
INDICATORS LIST
LIST OF TOPICS
PRINT THIS ARTICLE
by David Penn
A diamond pattern developed in the consumer discretionary sector and a reversal emerged.
Position: N/A
David Penn
Technical Writer for Technical Analysis of STOCKS & COMMODITIES magazine, Working-Money.com, and Traders.com Advantage.
PRINT THIS ARTICLE
THE DIAMOND
Bottoms And Discretionary Diamonds
05/19/05 08:25:12 AMby David Penn
A diamond pattern developed in the consumer discretionary sector and a reversal emerged.
Position: N/A
| Just call me "Diamond Dave." |
| In the same way that many Elliotticians can't see a stroke of lightning without trying to count the waves before the flash dies down, I'll admit to having diamond consolidation patterns on the brain. But in the same way that diamonds are allegedly a girl's best friend, diamond patterns can be pretty palsy-walsy with traders as well. |

|
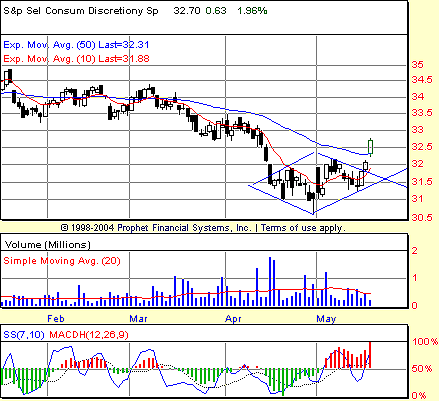
| Figure 1: Who put the indicator in my chart pattern? Who put the chart pattern in my indicator? Once again, indicators and chart patterns prove to be two technical "tastes" that taste great together as a positive divergence tips off an upside breakout from a diamond consolidation. |
| Graphic provided by: Prophet Financial, Inc. |
| |
| The consumer discretionary sector includes companies in the auto industry, as well as service industries like hotels and restaurants. Retail companies are also included in this group, covering areas such as apparel. Interestingly, the exchange-traded fund for the consumer discretionary sector, XLY, was formerly known as the "cyclical/transportation" sector. The key in the old name that is missing in the new one is the idea of cyclicality. In short, when the tough get going in an economy, cyclical stocks tend to be at the front of the pack. So it should be of little surprise that XLY developed a positive stochastic divergence in the second half of April. All the more interesting was the fact that the low mark in April arrived in the form of a Japanese hammer candlestick. The hammer is a classic Japanese candlestick type and, when appearing late in a downtrend, often anticipates a bottom and potential reversal. (Traders say the market is "hammering in" a bottom.) |
| Here, the hammer candlestick and positive stochastic divergence arrive in the context of a diamond consolidation (Figure 1). Diamond consolidations can lead to breaks to both the upside and the downside, but as I've suggested many times elsewhere, clues in other indicators can often tip us off as to which direction a break is likely to pursue. For example, in the context of a hammer candlestick and a positive divergence, the odds were that prices would break to the upside from the diamond rather than to the downside. |
| This is precisely what has happened in recent days. As far as the upside is concerned, XLY is moving quickly into potential resistance between 33 and 34, and it would not be surprising in the slightest if XLY's advance runs into difficulty at those levels. Similarly, a minimum price objective--gained by adding the size of the diamond pattern at its widest point to the value at the breakout--of about 33.38 only underscores the likelihood of rougher seas once XLY attempts to move much beyond the 50-day exponential moving average. Note also the faltering volume as XLY moves higher. |
Technical Writer for Technical Analysis of STOCKS & COMMODITIES magazine, Working-Money.com, and Traders.com Advantage.
| Title: | Technical Writer |
| Company: | Technical Analysis, Inc. |
| Address: | 4757 California Avenue SW |
| Seattle, WA 98116 | |
| Phone # for sales: | 206 938 0570 |
| Fax: | 206 938 1307 |
| Website: | www.Traders.com |
| E-mail address: | DPenn@traders.com |
Traders' Resource Links | |
| Charting the Stock Market: The Wyckoff Method -- Books | |
| Working-Money.com -- Online Trading Services | |
| Traders.com Advantage -- Online Trading Services | |
| Technical Analysis of Stocks & Commodities -- Publications and Newsletters | |
| Working Money, at Working-Money.com -- Publications and Newsletters | |
| Traders.com Advantage -- Publications and Newsletters | |
| Professional Traders Starter Kit -- Software | |
Click here for more information about our publications!
Comments
Date: 05/22/05Rank: 4Comment:
Date: 05/24/05Rank: 4Comment:

Request Information From Our Sponsors
- VectorVest, Inc.
- Executive Premier Workshop
- One-Day Options Course
- OptionsPro
- Retirement Income Workshop
- Sure-Fire Trading Systems (VectorVest, Inc.)
- Trading as a Business Workshop
- VectorVest 7 EOD
- VectorVest 7 RealTime/IntraDay
- VectorVest AutoTester
- VectorVest Educational Services
- VectorVest OnLine
- VectorVest Options Analyzer
- VectorVest ProGraphics v6.0
- VectorVest ProTrader 7
- VectorVest RealTime Derby Tool
- VectorVest Simulator
- VectorVest Variator
- VectorVest Watchdog
- StockCharts.com, Inc.
- Candle Patterns
- Candlestick Charting Explained
- Intermarket Technical Analysis
- John Murphy on Chart Analysis
- John Murphy's Chart Pattern Recognition
- John Murphy's Market Message
- MurphyExplainsMarketAnalysis-Intermarket Analysis
- MurphyExplainsMarketAnalysis-Visual Analysis
- StockCharts.com
- Technical Analysis of the Financial Markets
- The Visual Investor
