HOT TOPICS LIST
- MACD
- Fibonacci
- RSI
- Gann
- ADXR
- Stochastics
- Volume
- Triangles
- Futures
- Cycles
- Volatility
- ZIGZAG
- MESA
- Retracement
- Aroon
INDICATORS LIST
LIST OF TOPICS
PRINT THIS ARTICLE
by David Penn
Recently, I suggested higher prices for semiconductor stocks in the near term. By hammering in a bottom on high volume, KLAC is one stock among many that delivered.
Position: N/A
David Penn
Technical Writer for Technical Analysis of STOCKS & COMMODITIES magazine, Working-Money.com, and Traders.com Advantage.
PRINT THIS ARTICLE
CANDLESTICK CHARTING
Hammers On High Volume
05/19/05 07:31:37 AMby David Penn
Recently, I suggested higher prices for semiconductor stocks in the near term. By hammering in a bottom on high volume, KLAC is one stock among many that delivered.
Position: N/A
| Generally, I hate to refer back to a just-published Traders.com Advantage piece only a week after it has been posted--unless, of course, I completely blow an analysis and feel an overwhelming need to redeem myself. But the confluence of factors that has visited semiconductor stocks like KLA Tencor, as well as the confusing market environment we have been in for much--if not all--of 2005, encouraged me to think again about posting this article about KLAC. |
| Back near the beginning of the month, I suggested that semiconductors looked poised to head higher ("Strength In Semiconductors?" May 4, 2005). Involved in that notion was a 2B test of bottom and a positive divergence in the $SOX, or Philadelphia Semiconductor Sector index, that suggested that these stocks were quite capable of heading higher. Coming as it did after a two-month decline from the early March top, the idea of these stocks moving higher any time soon probably proved difficult to believe. |

|
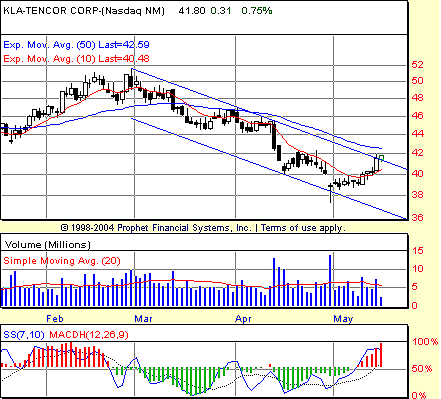
| Figure 1: A confluence of bullish clues conspired in late April: a positive stochastic divergence, an intraday penetration of the trend channel's lower boundary that reversed back into the channel at the close, and a hammer candlestick on overwhelming volume as prices gapped down below the 10-day exponential moving average. Two weeks later, KLAC was nearly 3 points higher. |
| Graphic provided by: Prophet Financial, Inc. |
| |
| I've found trend channels to be very worthwhile--both as part of my Elliott wave analysis as well as for more conventional technical purposes. And the behavior of KLAC in its trend channel in late April was telling. While KLAC broke down below the trend channel on high volume at the end of the month, the hammer Japanese candlestick suggested the potential for climactic volume, a sellout that would complete drain the market of those who were eager to sell and pave the way for those looking to buy KLAC at what they believed were bargain prices. |
| Add to all of this the fact that the lower low in KLAC at the end of April was matched by a higher low in the stochastic, creating a positive stochastic divergence. This divergence was all the more significant because it came as prices were extended to the downside. Take as evidence the fact that the 10-day exponential moving average (EMA) was more than 3 points below the 50-day EMA--with the close on the hammer day another full point below the 10-day EMA. While there is some subjectivity to any determination of prices being "overextended," KLAC seemed to fit a consensus of the criteria. |
| Potential resistance awaits KLAC at the 50-day EMA area between 42 and 43. Having already broken out above the upper boundary of the trend channel, KLAC is showing the sort of strength that suggests the 50-day EMA may prove no more a challenge than was the 10-day EMA that the stock broke out above back in early May. |
Technical Writer for Technical Analysis of STOCKS & COMMODITIES magazine, Working-Money.com, and Traders.com Advantage.
| Title: | Technical Writer |
| Company: | Technical Analysis, Inc. |
| Address: | 4757 California Avenue SW |
| Seattle, WA 98116 | |
| Phone # for sales: | 206 938 0570 |
| Fax: | 206 938 1307 |
| Website: | www.Traders.com |
| E-mail address: | DPenn@traders.com |
Traders' Resource Links | |
| Charting the Stock Market: The Wyckoff Method -- Books | |
| Working-Money.com -- Online Trading Services | |
| Traders.com Advantage -- Online Trading Services | |
| Technical Analysis of Stocks & Commodities -- Publications and Newsletters | |
| Working Money, at Working-Money.com -- Publications and Newsletters | |
| Traders.com Advantage -- Publications and Newsletters | |
| Professional Traders Starter Kit -- Software | |
Click here for more information about our publications!
Comments
Date: 05/22/05Rank: 4Comment:
Date: 05/24/05Rank: 3Comment:

|

Request Information From Our Sponsors
- StockCharts.com, Inc.
- Candle Patterns
- Candlestick Charting Explained
- Intermarket Technical Analysis
- John Murphy on Chart Analysis
- John Murphy's Chart Pattern Recognition
- John Murphy's Market Message
- MurphyExplainsMarketAnalysis-Intermarket Analysis
- MurphyExplainsMarketAnalysis-Visual Analysis
- StockCharts.com
- Technical Analysis of the Financial Markets
- The Visual Investor
- VectorVest, Inc.
- Executive Premier Workshop
- One-Day Options Course
- OptionsPro
- Retirement Income Workshop
- Sure-Fire Trading Systems (VectorVest, Inc.)
- Trading as a Business Workshop
- VectorVest 7 EOD
- VectorVest 7 RealTime/IntraDay
- VectorVest AutoTester
- VectorVest Educational Services
- VectorVest OnLine
- VectorVest Options Analyzer
- VectorVest ProGraphics v6.0
- VectorVest ProTrader 7
- VectorVest RealTime Derby Tool
- VectorVest Simulator
- VectorVest Variator
- VectorVest Watchdog
