HOT TOPICS LIST
- MACD
- Fibonacci
- RSI
- Gann
- ADXR
- Stochastics
- Volume
- Triangles
- Futures
- Cycles
- Volatility
- ZIGZAG
- MESA
- Retracement
- Aroon
INDICATORS LIST
LIST OF TOPICS
PRINT THIS ARTICLE
by Kevin Hopson
The last time I touched on Dell, the stock was close to giving another sell signal. Things have changed the past few weeks.
Position: N/A
Kevin Hopson
Kevin has been a technical analyst for roughly 10 years now. Previously, Kevin owned his own business and acted as a registered investment advisor, specializing in energy. He was also a freelance oil analyst for Orient Trading Co., a commodity futures trading firm in Japan. Kevin is currently a freelance writer.
PRINT THIS ARTICLE
ANDREWS PITCH-FORK
Dell's Buy Signal
05/18/05 07:52:08 AMby Kevin Hopson
The last time I touched on Dell, the stock was close to giving another sell signal. Things have changed the past few weeks.
Position: N/A
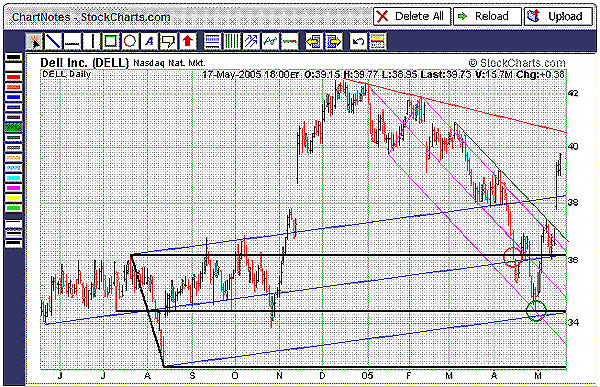
| When I touched on Dell Inc. (DELL) in mid-April, the stock was testing support around the $36.00 level. This was the site of the top black parallel line and the blue median line, as illustrated by the red circle (Figure 1). At that time, I said a break of support here would likely lead to a further pull back to the $34.00 level. This was the site of the black median line, bottom blue parallel line, and bottom purple parallel line. As you can see (per the green circle), Dell found ultimate support here and has rallied off this low. |

|
| Figure 1: DELL. In mid-April, the stock was testing support around the $36.00 level. This was the site of the top black parallel line and the blue median line, as illustrated by the red circle. As you can see (per the green circle), Dell found ultimate support and has rallied off this low. |
| Graphic provided by: StockCharts.com. |
| |
| In fact, Dell has overcome several key resistance areas in the process. For example, note how prices traded back above broken support ($36.00) early this month. Once this resistance level was taken out, Dell then proceeded to test the sliding green parallel line (or warning line). This warning line was drawn from the March high to give bears the benefit of the doubt when prices broke above the top purple parallel line. |
| As you can see, this trendline capped prices for over two months. However, Dell gapped above this downtrend line last week, effectively giving a buy signal. Because Dell cleared the top blue parallel line in the process, last December's downtrend line (red line) around $40.60 could be the next upside target for the stock. As a result, if the rally continues, look for Dell to make its way back above the $40.00 level in the near term. |
Kevin has been a technical analyst for roughly 10 years now. Previously, Kevin owned his own business and acted as a registered investment advisor, specializing in energy. He was also a freelance oil analyst for Orient Trading Co., a commodity futures trading firm in Japan. Kevin is currently a freelance writer.
| Glen Allen, VA | |
| E-mail address: | hopson_1@yahoo.com |
Click here for more information about our publications!
Comments
Date: 05/18/05Rank: 4Comment:

Request Information From Our Sponsors
- StockCharts.com, Inc.
- Candle Patterns
- Candlestick Charting Explained
- Intermarket Technical Analysis
- John Murphy on Chart Analysis
- John Murphy's Chart Pattern Recognition
- John Murphy's Market Message
- MurphyExplainsMarketAnalysis-Intermarket Analysis
- MurphyExplainsMarketAnalysis-Visual Analysis
- StockCharts.com
- Technical Analysis of the Financial Markets
- The Visual Investor
- VectorVest, Inc.
- Executive Premier Workshop
- One-Day Options Course
- OptionsPro
- Retirement Income Workshop
- Sure-Fire Trading Systems (VectorVest, Inc.)
- Trading as a Business Workshop
- VectorVest 7 EOD
- VectorVest 7 RealTime/IntraDay
- VectorVest AutoTester
- VectorVest Educational Services
- VectorVest OnLine
- VectorVest Options Analyzer
- VectorVest ProGraphics v6.0
- VectorVest ProTrader 7
- VectorVest RealTime Derby Tool
- VectorVest Simulator
- VectorVest Variator
- VectorVest Watchdog
