HOT TOPICS LIST
- MACD
- Fibonacci
- RSI
- Gann
- ADXR
- Stochastics
- Volume
- Triangles
- Futures
- Cycles
- Volatility
- ZIGZAG
- MESA
- Retracement
- Aroon
INDICATORS LIST
LIST OF TOPICS
PRINT THIS ARTICLE
by David Penn
A diamond top appears to have finally put a stop to the mesmerizing bull market in copper.
Position: N/A
David Penn
Technical Writer for Technical Analysis of STOCKS & COMMODITIES magazine, Working-Money.com, and Traders.com Advantage.
PRINT THIS ARTICLE
THE DIAMOND
Copper's Diamond Down
05/18/05 01:56:24 PMby David Penn
A diamond top appears to have finally put a stop to the mesmerizing bull market in copper.
Position: N/A
| Forget gold and silver. If you want to know what metal has been the most precious to investors and speculators over the past several months, then look no farther than the pennies in your pocket. As far as metals go, it is hard to top copper. |
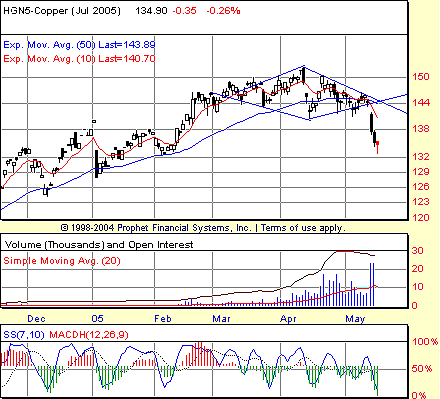
| Copper's bull market began back in autumn 2003, as prices rose above 80 cents. Between August 2003 and March 2004, copper's rise was nothing short of meteoric, rallying to nearly $1.40 (basis continuous futures). Since March 2004, copper has traded in a jagged, upwardly tilted triangle or wedge--a pattern that culminated at the top with more than $1.50 an ounce in April 2005, as shown in Figure 1. |

|
| Figure 1: Breaking down from a diamond top in May, July copper is showing the first signs of true weakness just as commodities across the board have come under pressure. |
| Graphic provided by: Prophet Financial, Inc. |
| |
| The wedging higher in copper that lasted a full year from the spring of 2004 to the spring of 2005 probably provided more headaches for traders than a hatful of hammers. Negative stochastic divergences, for example, which can often serve as excellent tools for anticipating market tops and reversals, repeatedly were denied significant followthrough to the downside. No denying the downside come mid-May, however. Basis July, the high price of copper in April registered another negative stochastic divergence. And as that negative stochastic divergence produced sideways action over the balance of April, copper slipped into a diamond top pattern. The diamond pattern consists of a pair of parallel lines drawn in the shape of a parallelogram or rhombus. |
| When it appears as a top, it is referred to as a diamond top, and when it appears as a bottom, it is referred to as a diamond bottom. Other times when this pattern appears, it is simply referred to as a diamond consolidation, from which the previous trend is expected to reemerge once the consolidation is complete. |
| Given the size of the diamond top in copper (approximately 12 cents), traders can expect a minimum move based on subtracting that amount from the value at the breakdown. With a value at the breakdown of approximately $1.44, a decline to $1.32 is the least a correction in copper should provide. |
Technical Writer for Technical Analysis of STOCKS & COMMODITIES magazine, Working-Money.com, and Traders.com Advantage.
| Title: | Technical Writer |
| Company: | Technical Analysis, Inc. |
| Address: | 4757 California Avenue SW |
| Seattle, WA 98116 | |
| Phone # for sales: | 206 938 0570 |
| Fax: | 206 938 1307 |
| Website: | www.Traders.com |
| E-mail address: | DPenn@traders.com |
Traders' Resource Links | |
| Charting the Stock Market: The Wyckoff Method -- Books | |
| Working-Money.com -- Online Trading Services | |
| Traders.com Advantage -- Online Trading Services | |
| Technical Analysis of Stocks & Commodities -- Publications and Newsletters | |
| Working Money, at Working-Money.com -- Publications and Newsletters | |
| Traders.com Advantage -- Publications and Newsletters | |
| Professional Traders Starter Kit -- Software | |
Click here for more information about our publications!
Comments
Date: 05/18/05Rank: 3Comment:
Date: 05/19/05Rank: 4Comment:

Request Information From Our Sponsors
- StockCharts.com, Inc.
- Candle Patterns
- Candlestick Charting Explained
- Intermarket Technical Analysis
- John Murphy on Chart Analysis
- John Murphy's Chart Pattern Recognition
- John Murphy's Market Message
- MurphyExplainsMarketAnalysis-Intermarket Analysis
- MurphyExplainsMarketAnalysis-Visual Analysis
- StockCharts.com
- Technical Analysis of the Financial Markets
- The Visual Investor
- VectorVest, Inc.
- Executive Premier Workshop
- One-Day Options Course
- OptionsPro
- Retirement Income Workshop
- Sure-Fire Trading Systems (VectorVest, Inc.)
- Trading as a Business Workshop
- VectorVest 7 EOD
- VectorVest 7 RealTime/IntraDay
- VectorVest AutoTester
- VectorVest Educational Services
- VectorVest OnLine
- VectorVest Options Analyzer
- VectorVest ProGraphics v6.0
- VectorVest ProTrader 7
- VectorVest RealTime Derby Tool
- VectorVest Simulator
- VectorVest Variator
- VectorVest Watchdog
