HOT TOPICS LIST
- MACD
- Fibonacci
- RSI
- Gann
- ADXR
- Stochastics
- Volume
- Triangles
- Futures
- Cycles
- Volatility
- ZIGZAG
- MESA
- Retracement
- Aroon
INDICATORS LIST
LIST OF TOPICS
PRINT THIS ARTICLE
by Kevin Hopson
Bullish divergences and a confluence of support could lead to a reversal at slightly lower prices.
Position: N/A
Kevin Hopson
Kevin has been a technical analyst for roughly 10 years now. Previously, Kevin owned his own business and acted as a registered investment advisor, specializing in energy. He was also a freelance oil analyst for Orient Trading Co., a commodity futures trading firm in Japan. Kevin is currently a freelance writer.
PRINT THIS ARTICLE
TECHNICAL ANALYSIS
A Forthcoming Reversal For Nabors Industries?
05/13/05 08:28:43 AMby Kevin Hopson
Bullish divergences and a confluence of support could lead to a reversal at slightly lower prices.
Position: N/A
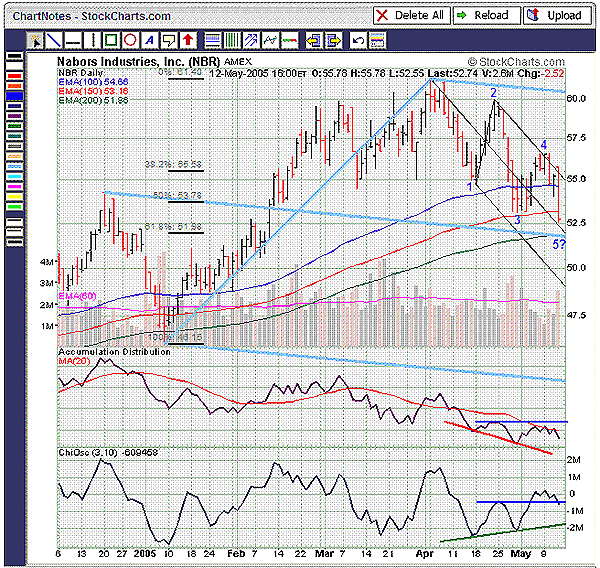
| Like most energy stocks, Nabors Industries (NBR) has been in a steep decline since early April. More specifically, if you look at the six-month chart (Figure 1), you will note that prices have continued to find resistance along the top parallel line of the black pitchfork the past few weeks. In addition, the stock recently closed below its 100-day and 150-day exponential moving averages (EMAs). Despite the weak action, Nabors may be closer to putting in a bottom than you think. |

|
| Figure 1: Nabors. If you look at the six-month chart, you will note that prices have continued to find resistance along the top parallel line of the black pitchfork the past few weeks. |
| Graphic provided by: StockCharts.com. |
| |
| For example, see how the accumulation/distribution (A/D) line has been moving lower since mid-April. However, the Chaikin oscillator has been moving higher during this period. Further, the oscillator recently moved above the late April high, while the A/D line has failed to do so. These are considered bullish divergences. If the Chaikin oscillator can make a decisive move above zero, this indicator will give a buy signal. |
| In the meantime, Nabors should find significant support around the $52.00 level. This is the site of the black and blue median lines, the stock's 200-day EMA ($51.86) and the 61.8% retracement level ($51.98) from the January to April rally. In addition, because the stock looks to be in the fifth and final wave of its current downtrend, the $52.00 level could act as an ultimate reversal point. In any event, the downside risk appears to be minimal here, which could present a good opportunity for long-term investors. |
Kevin has been a technical analyst for roughly 10 years now. Previously, Kevin owned his own business and acted as a registered investment advisor, specializing in energy. He was also a freelance oil analyst for Orient Trading Co., a commodity futures trading firm in Japan. Kevin is currently a freelance writer.
| Glen Allen, VA | |
| E-mail address: | hopson_1@yahoo.com |
Click here for more information about our publications!
Comments
Date: 05/13/05Rank: 4Comment:

Request Information From Our Sponsors
- StockCharts.com, Inc.
- Candle Patterns
- Candlestick Charting Explained
- Intermarket Technical Analysis
- John Murphy on Chart Analysis
- John Murphy's Chart Pattern Recognition
- John Murphy's Market Message
- MurphyExplainsMarketAnalysis-Intermarket Analysis
- MurphyExplainsMarketAnalysis-Visual Analysis
- StockCharts.com
- Technical Analysis of the Financial Markets
- The Visual Investor
- VectorVest, Inc.
- Executive Premier Workshop
- One-Day Options Course
- OptionsPro
- Retirement Income Workshop
- Sure-Fire Trading Systems (VectorVest, Inc.)
- Trading as a Business Workshop
- VectorVest 7 EOD
- VectorVest 7 RealTime/IntraDay
- VectorVest AutoTester
- VectorVest Educational Services
- VectorVest OnLine
- VectorVest Options Analyzer
- VectorVest ProGraphics v6.0
- VectorVest ProTrader 7
- VectorVest RealTime Derby Tool
- VectorVest Simulator
- VectorVest Variator
- VectorVest Watchdog
