HOT TOPICS LIST
- MACD
- Fibonacci
- RSI
- Gann
- ADXR
- Stochastics
- Volume
- Triangles
- Futures
- Cycles
- Volatility
- ZIGZAG
- MESA
- Retracement
- Aroon
INDICATORS LIST
LIST OF TOPICS
PRINT THIS ARTICLE
by David Penn
Shares of the retail stock HOLDRS broke down in April and retested a support-turned-resistance level early in May.
Position: N/A
David Penn
Technical Writer for Technical Analysis of STOCKS & COMMODITIES magazine, Working-Money.com, and Traders.com Advantage.
PRINT THIS ARTICLE
SUPPORT & RESISTANCE
Test And Retreat For Retail HOLDRS
05/13/05 10:56:49 AMby David Penn
Shares of the retail stock HOLDRS broke down in April and retested a support-turned-resistance level early in May.
Position: N/A
| An increasingly popular putdown among some economists and financial types in the blogosphere is to refer to an intellectual adversary as the "stupidest man alive." I won't mention who has most recently been the target of this not-so-heroic simile. But I'll admit that I wanted to present my own nominee for the title after reading a certain bond market analyst's opinion of how improvements in the net sales of a few retail stores is evidence that "income growth is outpacing the spike in oil." |
| Actually, my candidate might have had a point if in fact real incomes were growing. Unfortunately, as the Financial Times of London recently reported two days before the aforementioned opinion, real wages in the United States "are falling at their fastest rate in 14 years," according to data surveyed by the Financial Times. And I have a feeling that the only people surprised by this news are financial pundits. |

|
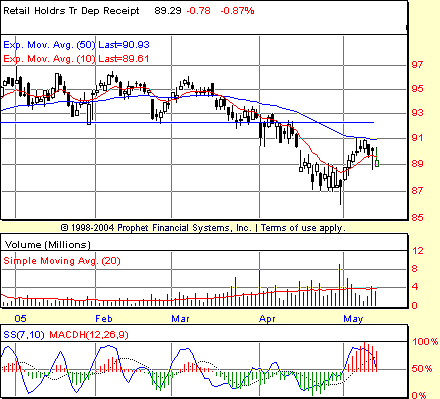
| Figure 1: RTH. Breaking down in April from a multimonth, sideways consolidation, the retail industry HOLDRS found support between 86 and 87, and rallied to test the lower boundary of the previous consolidation range. |
| Graphic provided by: Prophet Financial, Inc. |
| |
| Let's take a look at what is really happening in retail, courtesy of Figure 1, this chart of the retail industry HOLDRS. There was a time when retail--or at least, retail stocks--were on a real tear. But that time was during the bull market upswing from August 2004 through the end of the year. In fact, while a number of other sectors--as well as the broader stock market--were making higher highs through late 2004 and into 2005, retail pooped out in early November (around the same time, interestingly enough, as gold mining shares). |
| Since the November peak, retail stocks have spent months in a sideways consolidation no more than 4 points high at its widest point, and featuring apparently rock-solid support at about the 96 level. However, that long-term support eventually did begin to give way in late March, with shares truly collapsing in April. This collapse sent RTH hurtling from the mid-90s to the mid-80s by mid-April when the RTH put in a hammer candlestick on exceptional volume, establishing a swing low--at least for the time being. From mid-April into mid-May, the retail stocks have been bouncing. Unfortunately for retail bulls, much of this rising action going into May has been accomplished on ever-declining volume up until most recently. And when volume did begin to pick up again, it did so on days when the RTH finished down for the session. In other words, these instances of higher volume were likely distribution days. |
| That this action came as the RTH was rallying back toward the lower boundary of the sideways consolidation that had characterized the RTH since mid-November 2004 presents all the more challenge for those looking for broad-based higher prices for retail stocks. In fact, not only does the RTH have the lower boundary of the trend channel to deal with, but there is also potential resistance in the form of the 50-day exponential moving average just south of 91. |
Technical Writer for Technical Analysis of STOCKS & COMMODITIES magazine, Working-Money.com, and Traders.com Advantage.
| Title: | Technical Writer |
| Company: | Technical Analysis, Inc. |
| Address: | 4757 California Avenue SW |
| Seattle, WA 98116 | |
| Phone # for sales: | 206 938 0570 |
| Fax: | 206 938 1307 |
| Website: | www.Traders.com |
| E-mail address: | DPenn@traders.com |
Traders' Resource Links | |
| Charting the Stock Market: The Wyckoff Method -- Books | |
| Working-Money.com -- Online Trading Services | |
| Traders.com Advantage -- Online Trading Services | |
| Technical Analysis of Stocks & Commodities -- Publications and Newsletters | |
| Working Money, at Working-Money.com -- Publications and Newsletters | |
| Traders.com Advantage -- Publications and Newsletters | |
| Professional Traders Starter Kit -- Software | |
Click here for more information about our publications!
Comments
Date: 05/13/05Rank: 3Comment:

Request Information From Our Sponsors
- StockCharts.com, Inc.
- Candle Patterns
- Candlestick Charting Explained
- Intermarket Technical Analysis
- John Murphy on Chart Analysis
- John Murphy's Chart Pattern Recognition
- John Murphy's Market Message
- MurphyExplainsMarketAnalysis-Intermarket Analysis
- MurphyExplainsMarketAnalysis-Visual Analysis
- StockCharts.com
- Technical Analysis of the Financial Markets
- The Visual Investor
- VectorVest, Inc.
- Executive Premier Workshop
- One-Day Options Course
- OptionsPro
- Retirement Income Workshop
- Sure-Fire Trading Systems (VectorVest, Inc.)
- Trading as a Business Workshop
- VectorVest 7 EOD
- VectorVest 7 RealTime/IntraDay
- VectorVest AutoTester
- VectorVest Educational Services
- VectorVest OnLine
- VectorVest Options Analyzer
- VectorVest ProGraphics v6.0
- VectorVest ProTrader 7
- VectorVest RealTime Derby Tool
- VectorVest Simulator
- VectorVest Variator
- VectorVest Watchdog
