HOT TOPICS LIST
- MACD
- Fibonacci
- RSI
- Gann
- ADXR
- Stochastics
- Volume
- Triangles
- Futures
- Cycles
- Volatility
- ZIGZAG
- MESA
- Retracement
- Aroon
INDICATORS LIST
LIST OF TOPICS
PRINT THIS ARTICLE
by Arthur Hill
Shares of Hewlett-Packard have enjoyed a nice advance since August, but the move appears to be nearing its end as momentum wanes.
Position: Sell
Arthur Hill
Arthur Hill is currently editor of TDTrader.com, a website specializing in trading strategies, sector/industry specific breadth stats and overall technical analysis. He passed the Society of Technical Analysts (STA London) diploma exam with distinction is a Certified Financial Technician (CFTe). Prior to TD Trader, he was the Chief Technical Analyst for Stockcharts.com and the main contributor to the ChartSchool.
PRINT THIS ARTICLE
WEDGE FORMATIONS
The Dreaded Wedge Appears In Hewlett-Packard
05/12/05 07:45:58 AMby Arthur Hill
Shares of Hewlett-Packard have enjoyed a nice advance since August, but the move appears to be nearing its end as momentum wanes.
Position: Sell
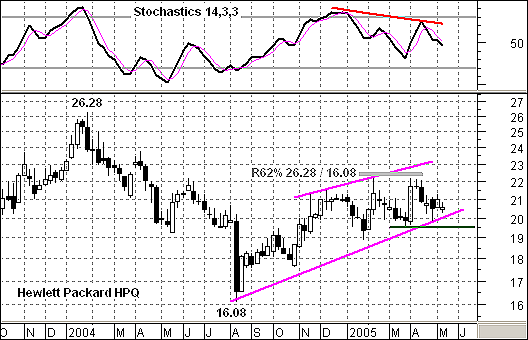
| On the weekly chart (Figure 1), the pattern and the retracement are classic. After a sharp decline, the stock retraced 62% with an advance just above 22. This is a normal retracement for a corrective rally. In addition, the pattern looks like a rising wedge, which is a bearish corrective pattern. In other words, the current advance runs counter to the larger trend and is expected to fail. |

|
| Figure 1: HPQ. The current advance runs counter to the larger trend and is expected to fail. |
| Graphic provided by: MetaStock. |
| Graphic provided by: Reuters Data. |
| |
| As the stock tested resistance around 22 in January and April, the weekly stochastic oscillator formed a noticeable negative divergence. The indicator moved to overbought in December (above 80) and formed a lower high in January. The April high exceeded the January high, but fell well short of the December high, and the negative divergence still looms (red trendlines). The inability to make it back above 80 shows less upside momentum and increases the chances of a bearish reversal. |
| The March low holds the key. With two relatively equal peaks in January and April, a small double top has evolved. The March low sits in between and marks key support at 19.5. A move below this level would break the rising wedge and prior low to turn the trend bearish. The downside target would be the August low around 16. |
Arthur Hill is currently editor of TDTrader.com, a website specializing in trading strategies, sector/industry specific breadth stats and overall technical analysis. He passed the Society of Technical Analysts (STA London) diploma exam with distinction is a Certified Financial Technician (CFTe). Prior to TD Trader, he was the Chief Technical Analyst for Stockcharts.com and the main contributor to the ChartSchool.
| Title: | Editor |
| Company: | TDTrader.com |
| Address: | Willem Geetsstraat 17 |
| Mechelen, B2800 | |
| Phone # for sales: | 3215345465 |
| Website: | www.tdtrader.com |
| E-mail address: | arthurh@tdtrader.com |
Traders' Resource Links | |
| TDTrader.com has not added any product or service information to TRADERS' RESOURCE. | |
Click here for more information about our publications!
Comments
Date: 05/12/05Rank: 4Comment:

|

Request Information From Our Sponsors
- StockCharts.com, Inc.
- Candle Patterns
- Candlestick Charting Explained
- Intermarket Technical Analysis
- John Murphy on Chart Analysis
- John Murphy's Chart Pattern Recognition
- John Murphy's Market Message
- MurphyExplainsMarketAnalysis-Intermarket Analysis
- MurphyExplainsMarketAnalysis-Visual Analysis
- StockCharts.com
- Technical Analysis of the Financial Markets
- The Visual Investor
- VectorVest, Inc.
- Executive Premier Workshop
- One-Day Options Course
- OptionsPro
- Retirement Income Workshop
- Sure-Fire Trading Systems (VectorVest, Inc.)
- Trading as a Business Workshop
- VectorVest 7 EOD
- VectorVest 7 RealTime/IntraDay
- VectorVest AutoTester
- VectorVest Educational Services
- VectorVest OnLine
- VectorVest Options Analyzer
- VectorVest ProGraphics v6.0
- VectorVest ProTrader 7
- VectorVest RealTime Derby Tool
- VectorVest Simulator
- VectorVest Variator
- VectorVest Watchdog
