HOT TOPICS LIST
- MACD
- Fibonacci
- RSI
- Gann
- ADXR
- Stochastics
- Volume
- Triangles
- Futures
- Cycles
- Volatility
- ZIGZAG
- MESA
- Retracement
- Aroon
INDICATORS LIST
LIST OF TOPICS
PRINT THIS ARTICLE
by David Penn
Ascending triangles with downside breaks! Long-term resistance becomes intraday support! Dogs and cats living together!
Position: N/A
David Penn
Technical Writer for Technical Analysis of STOCKS & COMMODITIES magazine, Working-Money.com, and Traders.com Advantage.
PRINT THIS ARTICLE
SUPPORT & RESISTANCE
Broken Triangles, Broken Trendlines
05/11/05 01:27:58 PMby David Penn
Ascending triangles with downside breaks! Long-term resistance becomes intraday support! Dogs and cats living together!
Position: N/A
| Ascending triangles, consolidations in which prices are bound by a set of converging trendlines with one of those trendlines representing a horizontal resistance level, and the other upwardly sloped support, lead to breakouts to the upside. |
| Except when they don't. |

|
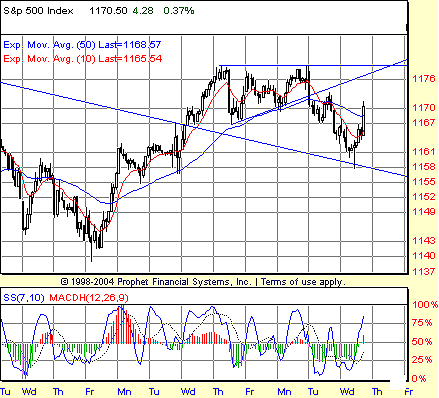
| Figure 1: $SPX. Surprisingly breaking out to the downside from this ascending triangle, the $SPX nevertheless reaches a minimum downside price objective based on the width of the consolidation at its widest part. |
| Graphic provided by: Prophet Financial, Inc. |
| |
| Even though ascending triangles tend to be one of the more reliable patterns in terms of regularly producing a break to the upside, the markets will certainly do what they will do. And in this instance, what they chose to do was collapse. Interestingly enough, the triangle did accurately tip traders off to the minimum move to be expected once the pattern was broken. The problem, I'm guessing, was that the majority was betting on the long side. Let's take a closer look at the breakdown. The ascending triangle measured about 11 %BE at its widest point. Subtracting that amount from the value at the breakout (1170) gives a downside minimum objective of 1158 %BC. As the chart of the Standard & Poor's 500 index in Figure 1 shows, the $SPX fell to as low as 1157.71 before snapping back sharply. |
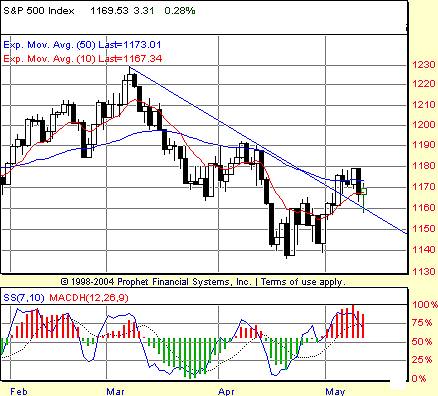
| What is the cause of such a sharp snapback? Those unfortunately caught short during that updraft will probably blame an unidentified aircraft that flew into restricted airspace above the White House on May 11, precipitating a precautionary evacuation. However, market technicians might note instead that the breakdown from the triangle--and the subsequent snapback bounce--came courtesy of a longer-term downtrend line that, with today's action, just turned into support. |

|
| Figure 2: $SPX. Once broken, the downtrend line that has guided the market lower in 2005 turned into a level of support for a pullback in May. |
| Graphic provided by: Prophet Financial, Inc. |
| |
| Given the way the market has behaved of late, this resistance-turned-support is a boon for the bulls. While subsequent price action will be key, the way the market attempted to move lower and was repelled by the now-supportive trendline was worth a great deal to those building a case for higher stock prices. |
Technical Writer for Technical Analysis of STOCKS & COMMODITIES magazine, Working-Money.com, and Traders.com Advantage.
| Title: | Technical Writer |
| Company: | Technical Analysis, Inc. |
| Address: | 4757 California Avenue SW |
| Seattle, WA 98116 | |
| Phone # for sales: | 206 938 0570 |
| Fax: | 206 938 1307 |
| Website: | www.Traders.com |
| E-mail address: | DPenn@traders.com |
Traders' Resource Links | |
| Charting the Stock Market: The Wyckoff Method -- Books | |
| Working-Money.com -- Online Trading Services | |
| Traders.com Advantage -- Online Trading Services | |
| Technical Analysis of Stocks & Commodities -- Publications and Newsletters | |
| Working Money, at Working-Money.com -- Publications and Newsletters | |
| Traders.com Advantage -- Publications and Newsletters | |
| Professional Traders Starter Kit -- Software | |
Click here for more information about our publications!
Comments
Date: 05/11/05Rank: 3Comment:
Date: 05/12/05Rank: 4Comment:

|

Request Information From Our Sponsors
- StockCharts.com, Inc.
- Candle Patterns
- Candlestick Charting Explained
- Intermarket Technical Analysis
- John Murphy on Chart Analysis
- John Murphy's Chart Pattern Recognition
- John Murphy's Market Message
- MurphyExplainsMarketAnalysis-Intermarket Analysis
- MurphyExplainsMarketAnalysis-Visual Analysis
- StockCharts.com
- Technical Analysis of the Financial Markets
- The Visual Investor
- VectorVest, Inc.
- Executive Premier Workshop
- One-Day Options Course
- OptionsPro
- Retirement Income Workshop
- Sure-Fire Trading Systems (VectorVest, Inc.)
- Trading as a Business Workshop
- VectorVest 7 EOD
- VectorVest 7 RealTime/IntraDay
- VectorVest AutoTester
- VectorVest Educational Services
- VectorVest OnLine
- VectorVest Options Analyzer
- VectorVest ProGraphics v6.0
- VectorVest ProTrader 7
- VectorVest RealTime Derby Tool
- VectorVest Simulator
- VectorVest Variator
- VectorVest Watchdog
