HOT TOPICS LIST
- MACD
- Fibonacci
- RSI
- Gann
- ADXR
- Stochastics
- Volume
- Triangles
- Futures
- Cycles
- Volatility
- ZIGZAG
- MESA
- Retracement
- Aroon
INDICATORS LIST
LIST OF TOPICS
PRINT THIS ARTICLE
by Kevin Hopson
A combination of Elliott wave theory and pitchfork analysis may have signaled a bottom for this stock.
Position: N/A
Kevin Hopson
Kevin has been a technical analyst for roughly 10 years now. Previously, Kevin owned his own business and acted as a registered investment advisor, specializing in energy. He was also a freelance oil analyst for Orient Trading Co., a commodity futures trading firm in Japan. Kevin is currently a freelance writer.
PRINT THIS ARTICLE
ANDREWS PITCH-FORK
Has The Trend Reversed For USEC Inc.?
05/11/05 07:40:27 AMby Kevin Hopson
A combination of Elliott wave theory and pitchfork analysis may have signaled a bottom for this stock.
Position: N/A
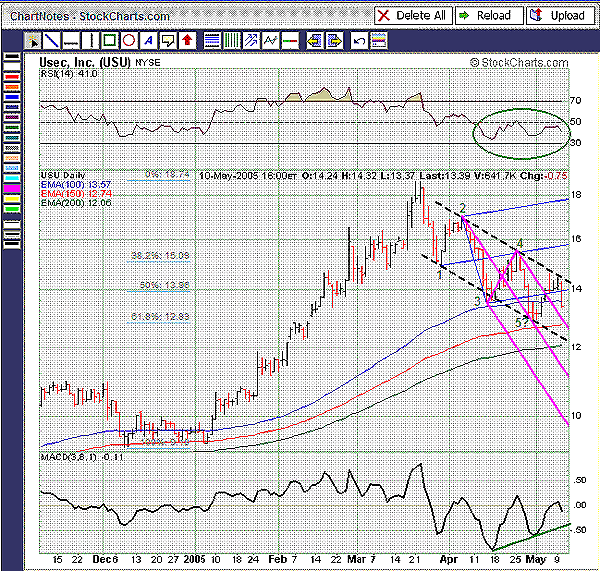
| USEC Inc. (USU) has been in a clear downtrend since late March, as illustrated by the falling channel formation in the six-month chart (Figure 1). However, this downtrend may be coming to an end if it has not ended already. I say this because pitchfork analysis has accurately predicted each of the major turning points during this downtrend, and the fifth and final wave may have been completed. |

|
| Figure 1: :USEC, six-month chart. USU has been in a clear downtrend since late March, as illustrated by the falling channel formation. |
| Graphic provided by: StockCharts.com. |
| |
| Before I explain that, it is important to understand what median lines are and how they work. A median line is a trendline that is drawn from one pivot point through the middle of two other pivot points. This is illustrated by the blue pitchfork, which uses the 1, 2, and 3 pivot points. Prices tend to reverse at the median line, making it an accurate tool in determining the completion point of a move. More specifically, the 1-2/3 pitchfork is used to predict the fourth pivot point, or the end of the fourth wave (second leg up). As you can see, prices reversed at the blue median line. |
| When this occurred, I used the 2-3/4 pitchfork to predict the fifth and final pivot point of the trend. If you look at the purple pitchfork, you will note that the median line once again acted as a reversal point for prices. Because the blue and purple median lines worked successfully, we can be more confident in the wave count. In addition, see how the potential fifth wave was completed at the 61.8% retracement level ($12.83) from the December 2004 to March 2005 rally. This supports the theory that a bottom has been put in. |
| Even if the wave count proves to be wrong and USEC hits a new low during this downtrend, there are signs of a developing bottom. For example, note how the relative strength index (RSI) and moving average convergence/divergence (MACD) have both been moving higher since mid-April despite declining prices. Bullish divergences such as these often precede a reversal. |
| Moreover, short interest for USEC was 4.67 million shares as of April 8, an increase of 12% from the prior month. This equates to a short interest ratio of nearly 3.5x. Given the likely bottom that is developing and potential buying pressure (short interest) to push prices higher, the downside risk appears to be minimal. If the stock can break April's downtrend line (top channel line) around $14.40, it will all but confirm a trend reversal. |
Kevin has been a technical analyst for roughly 10 years now. Previously, Kevin owned his own business and acted as a registered investment advisor, specializing in energy. He was also a freelance oil analyst for Orient Trading Co., a commodity futures trading firm in Japan. Kevin is currently a freelance writer.
| Glen Allen, VA | |
| E-mail address: | hopson_1@yahoo.com |
Click here for more information about our publications!
Comments
Date: 05/11/05Rank: 4Comment:

Request Information From Our Sponsors
- StockCharts.com, Inc.
- Candle Patterns
- Candlestick Charting Explained
- Intermarket Technical Analysis
- John Murphy on Chart Analysis
- John Murphy's Chart Pattern Recognition
- John Murphy's Market Message
- MurphyExplainsMarketAnalysis-Intermarket Analysis
- MurphyExplainsMarketAnalysis-Visual Analysis
- StockCharts.com
- Technical Analysis of the Financial Markets
- The Visual Investor
- VectorVest, Inc.
- Executive Premier Workshop
- One-Day Options Course
- OptionsPro
- Retirement Income Workshop
- Sure-Fire Trading Systems (VectorVest, Inc.)
- Trading as a Business Workshop
- VectorVest 7 EOD
- VectorVest 7 RealTime/IntraDay
- VectorVest AutoTester
- VectorVest Educational Services
- VectorVest OnLine
- VectorVest Options Analyzer
- VectorVest ProGraphics v6.0
- VectorVest ProTrader 7
- VectorVest RealTime Derby Tool
- VectorVest Simulator
- VectorVest Variator
- VectorVest Watchdog
