HOT TOPICS LIST
- MACD
- Fibonacci
- RSI
- Gann
- ADXR
- Stochastics
- Volume
- Triangles
- Futures
- Cycles
- Volatility
- ZIGZAG
- MESA
- Retracement
- Aroon
INDICATORS LIST
LIST OF TOPICS
PRINT THIS ARTICLE
by Paolo Pezzutti
Understanding market conditions is important for timing your trades.
Position: N/A
Paolo Pezzutti
Author of the book "Trading the US Markets - A Comprehensive Guide to US Markets for International Traders and Investors" - Harriman House (July 2008)
PRINT THIS ARTICLE
TECHNICAL ANALYSIS
Identifying Congestions
05/09/05 01:54:02 PMby Paolo Pezzutti
Understanding market conditions is important for timing your trades.
Position: N/A
| Markets move typically alternating between trends and congestions. Statistics say that markets spend longer periods of time developing congestions and trading ranges than trending. The move to new areas of balance is then fast and usually short. A trend may already be over when most participants (especially the crowd) see a sharp rally or selloff. The swing trader tries to enter a low-risk position and lets the crowd push it into an expansion breakout for a short-term trade. It is not important if you are a trend-follower or a contrarian; early discovery of a congestion phase provides you with valuable information. |
| Many think that congestions should not be traded. During these phases, volume gets lower and volatility is low. It is also true that it is from this area that potential big moves may develop. The market is contracting and there's no interest from the crowd. Entering a trade during congestions presents very high-reward and low-risk characteristics. For example, typical patterns to trade are the breakout of an ID/NR4 day (inside day/narrowest daily range of the last four days), NR7 (narrowest daily range of the last seven days). As markets spend most of the time in this condition, it is also possible for a daytrader to scalp small profits in a dull market, exploiting price movement from support to resistance and back from resistance to support. |
| Whatever you intend to do, spotting congestion areas as soon as possible is quite important. The method that I propose is explained by Joe Ross and Mark Cherlin in their book, Electronic Trading "TNT" IV: Tips, Tricks And Other Trading Stuff. Sideways price movement can be divided into three main areas: - Ledges: Consisting of no more than 10 price bars. To be most effective, ledges must occur in trending markets and the breakout is best traded in the direction of the trend. - Congestions: 11-20 price bars inclusive - Trading ranges: 21 bars or more with a breakout occurring usually on price bars 21-29 inclusive. We will focus here on congestions. Rules are: Congestion by opens/closes: Every time prices open or close on four consecutive bars within the range of a so-called "measuring bar," you have congestion. The relative position of highs and lows is not important. A "measuring bar" is such that when its range contains the open or closes of at least the next three bars. Congestion by combination: A series of four consecutive dojis, or at least one doji and any three alternating bars. Congestion by alternation: A series of four consecutive alternating open high/close low, open low/close high bars in any sequence. |
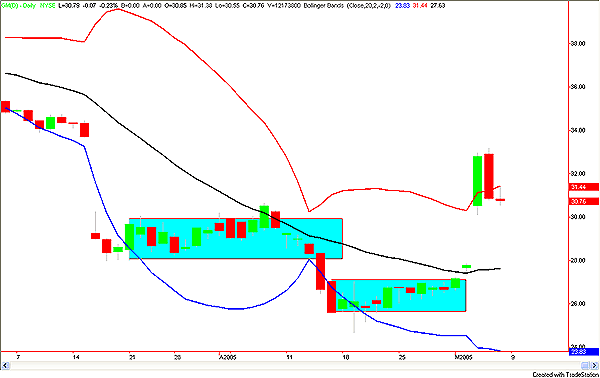
| In Figure 1, you can see the General Motors daily chart. The two rectangles contain the congestion areas that both last more than 10 days. The exit from congestion in both cases is fast and short with an explosion in volatility. The longer the congestion, the higher is the volatility expansion you might expect. Note also that, especially in the first congestion that started on March 21, the Bollinger Bands continued to converge right before the breakout, signaling an impending move. |

|
| Figure 1: General Motors daily chart. The two rectangles represent the congestion areas that both last more than 10 days. |
| Graphic provided by: TradeStation. |
| |
| Of course, what I have shown is one of many possible ways to spot congestion areas. I find it useful, especially if it is coupled with other indicators. In particular, I believe that Bollinger Bands are quite effective in this regard. Bollinger Bands combine the trend analysis information of a moving average with the market's volatility. The distance between bands is a reflection of volatility. The bands during sideways periods contain prices, while at the beginning of trends, bands tend to open with volatility expansion. Using the Bollinger Bands, you can reinforce indications about trend or trading range conditions. |
Author of the book "Trading the US Markets - A Comprehensive Guide to US Markets for International Traders and Investors" - Harriman House (July 2008)
| Address: | VIA ROBERTO AGO 26 POSTAL CODE 00166 |
| Rome, ITALY | |
| Phone # for sales: | +393357540708 |
| E-mail address: | pezzutti.paolo@tiscali.it |
Click here for more information about our publications!
Comments
Date: 05/09/05Rank: 3Comment:
Date: 05/10/05Rank: 4Comment:
Date: 05/11/05Rank: 4Comment:

Request Information From Our Sponsors
- VectorVest, Inc.
- Executive Premier Workshop
- One-Day Options Course
- OptionsPro
- Retirement Income Workshop
- Sure-Fire Trading Systems (VectorVest, Inc.)
- Trading as a Business Workshop
- VectorVest 7 EOD
- VectorVest 7 RealTime/IntraDay
- VectorVest AutoTester
- VectorVest Educational Services
- VectorVest OnLine
- VectorVest Options Analyzer
- VectorVest ProGraphics v6.0
- VectorVest ProTrader 7
- VectorVest RealTime Derby Tool
- VectorVest Simulator
- VectorVest Variator
- VectorVest Watchdog
- StockCharts.com, Inc.
- Candle Patterns
- Candlestick Charting Explained
- Intermarket Technical Analysis
- John Murphy on Chart Analysis
- John Murphy's Chart Pattern Recognition
- John Murphy's Market Message
- MurphyExplainsMarketAnalysis-Intermarket Analysis
- MurphyExplainsMarketAnalysis-Visual Analysis
- StockCharts.com
- Technical Analysis of the Financial Markets
- The Visual Investor
