HOT TOPICS LIST
- MACD
- Fibonacci
- RSI
- Gann
- ADXR
- Stochastics
- Volume
- Triangles
- Futures
- Cycles
- Volatility
- ZIGZAG
- MESA
- Retracement
- Aroon
INDICATORS LIST
LIST OF TOPICS
PRINT THIS ARTICLE
by Koos van der Merwe
Is gold gearing up for a breakout?
Position: Accumulate
Koos van der Merwe
Has been a technical analyst since 1969, and has worked as a futures and options trader with First Financial Futures in Johannesburg, South Africa.
PRINT THIS ARTICLE
TRIANGLES
Time To Look At Gold Again
05/06/05 10:23:08 AMby Koos van der Merwe
Is gold gearing up for a breakout?
Position: Accumulate
| Gold is a US dollar play--that is, the weaker the US dollar is, the higher the gold price, but in US dollars. In euros and other foreign currency that do not move in tandem with the US dollar, gold is moving sideways, if at all, but we in North America have the opportunity to cash in on gold's expected rise. |
That said, I am still intrigued by all the hullabaloo about Warren Buffett's position regarding the US dollar, which, of course, will reflect on the strength of the gold price. A well-known daily newsletter started a recent day's commentary with "The US Dollar Is Again Weak" as the market tried to ascertain what to make of the Federal Reserve's rather strange error earlier this week. Then later in his newsletter, the commentator opined:"We are comfortable being bullish of gold in US dollar terms." Then, clearly, it is time to have a deeper look at gold. |

|
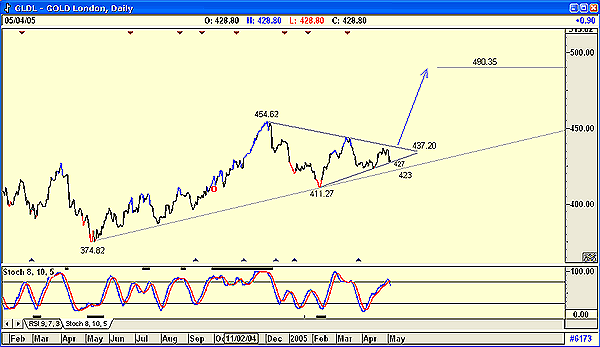
| Figure 1: Daily Gold. Here's a daily chart of the London gold price, and we can see that a consolidation triangle appears to be developing. |
| Graphic provided by: AdvancedGET. |
| |
| Figure 1 is a daily chart of the London gold price, and we can see that a consolidation triangle appears to be developing. Should the price of gold break above $437.20, its target price will be $490.35 (454.62 - 374.82 = 79.80 + 411.27 = 490.35), close enough to $500 to get everyone excited enough to guesstimate gold's ultimate target at $1,000 per ounce. The downside to this optimism is, of course, the stochastic indicator, which suggests that gold could prefer to test the main support line at $423 before moving up to $437.20. Either way, it will present a new buying opportunity for risky gold bulls, although I would prefer to wait for the break above $437.20 before testing the water. |

|
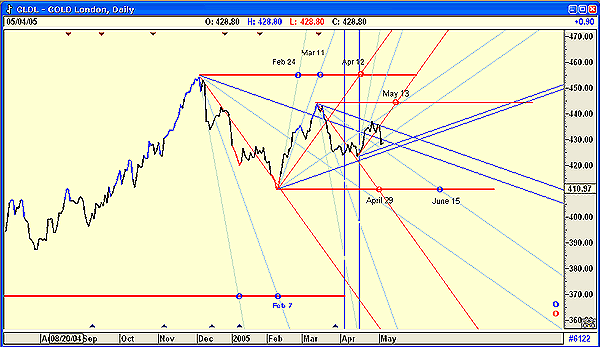
| Figure 2: Gann fan chart. This Gann fan chart is used to determine possible turning points. |
| Graphic provided by: AdvancedGET. |
| |
| Figure 2 is a Gann fan chart used to determine possible turning points. The fans are drawn from interim highs and lows, and the crossing of the horizontal trendline drawn from a previous high or low by the fan, as shown, is remarkably accurate in determining a turning point. The chart may look too busy, but it is worth studying. The Gann fan chart is suggesting that the next turning point is May 13, which means that gold may fall to test the main support line at $423. |
| That gold is bullish in US dollar terms is without question, with a short-term target of approximately $500. With many of the larger US mining companies holding mines all over the world, and earning in currencies other than US dollars, the viability of owning these companies is suspect. We should therefore look for companies/shares that earn in US dollars only or, of course, buy gold itself. |
Has been a technical analyst since 1969, and has worked as a futures and options trader with First Financial Futures in Johannesburg, South Africa.
| Address: | 3256 West 24th Ave |
| Vancouver, BC | |
| Phone # for sales: | 6042634214 |
| E-mail address: | petroosp@gmail.com |
Click here for more information about our publications!
Comments
Date: 05/06/05Rank: 4Comment:
Date: 05/10/05Rank: 4Comment:
Date: 05/11/05Rank: 5Comment:

Request Information From Our Sponsors
- StockCharts.com, Inc.
- Candle Patterns
- Candlestick Charting Explained
- Intermarket Technical Analysis
- John Murphy on Chart Analysis
- John Murphy's Chart Pattern Recognition
- John Murphy's Market Message
- MurphyExplainsMarketAnalysis-Intermarket Analysis
- MurphyExplainsMarketAnalysis-Visual Analysis
- StockCharts.com
- Technical Analysis of the Financial Markets
- The Visual Investor
- VectorVest, Inc.
- Executive Premier Workshop
- One-Day Options Course
- OptionsPro
- Retirement Income Workshop
- Sure-Fire Trading Systems (VectorVest, Inc.)
- Trading as a Business Workshop
- VectorVest 7 EOD
- VectorVest 7 RealTime/IntraDay
- VectorVest AutoTester
- VectorVest Educational Services
- VectorVest OnLine
- VectorVest Options Analyzer
- VectorVest ProGraphics v6.0
- VectorVest ProTrader 7
- VectorVest RealTime Derby Tool
- VectorVest Simulator
- VectorVest Variator
- VectorVest Watchdog
