HOT TOPICS LIST
- MACD
- Fibonacci
- RSI
- Gann
- ADXR
- Stochastics
- Volume
- Triangles
- Futures
- Cycles
- Volatility
- ZIGZAG
- MESA
- Retracement
- Aroon
INDICATORS LIST
LIST OF TOPICS
PRINT THIS ARTICLE
by David Penn
Positive divergences suggest that the downside in 10-year yields may be increasingly limited.
Position: N/A
David Penn
Technical Writer for Technical Analysis of STOCKS & COMMODITIES magazine, Working-Money.com, and Traders.com Advantage.
PRINT THIS ARTICLE
REVERSAL
10-Year Treasury Notes Work Toward A Bottom
05/05/05 11:29:53 AMby David Penn
Positive divergences suggest that the downside in 10-year yields may be increasingly limited.
Position: N/A
| A few weeks back, I highlighted the head and shoulders top in $TNX, the proxy for the yield on the 10-year Treasury note ("The 10-Year Note's Head And Shoulders Top," Traders.com Advantage, April 19, 2005). |
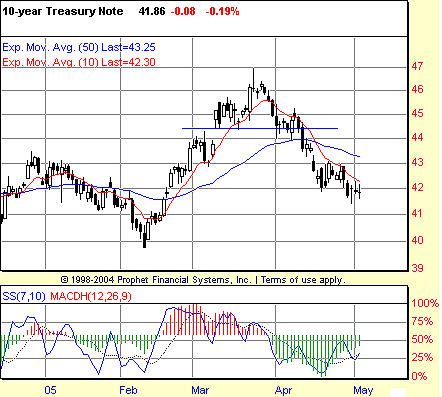
| At the time, the $TNX was trading near $42.50 (equivalent to a yield of 4.25%). Given the dimensions of the head and shoulders top, I measured a minimum downside to the $41 level (see Figure 1). |

|
| Figure 1: As the $TNX nears its minimum downside objective near $41, a positive stochastic divergence appears--further suggesting that the downside is increasingly limited. |
| Graphic provided by: Prophet Financial, Inc. |
| |
| But a funny thing seems to be happening to $TNX en route to its minimum downside objective. Compare the consecutively lower price troughs in mid-April and at the end of April, to the consecutively higher troughs in the 7,10 stochastic, and it is clear that a positive stochastic divergence is developing. |
| Confirmation of this positive stochastic divergence--confirmation that would suggest a higher value for $TNX and higher interest rates for long-term borrowers--would require a move above $43 or so. The moving average convergence/divergence histogram (MACDH) suggests a potential entry just a little lower in the $42.42 area. |
| I still suspect that $TNX will reach its downside objective, perhaps accompanied by still further positive divergences (or "running" divergences). But those who see in a falling $TNX a silver lining against the gloom of a slowing economy may find themselves surprised, should that silver lining put in a higher low vis-a-vis the February 2005 lows, and begin to move higher. |
Technical Writer for Technical Analysis of STOCKS & COMMODITIES magazine, Working-Money.com, and Traders.com Advantage.
| Title: | Technical Writer |
| Company: | Technical Analysis, Inc. |
| Address: | 4757 California Avenue SW |
| Seattle, WA 98116 | |
| Phone # for sales: | 206 938 0570 |
| Fax: | 206 938 1307 |
| Website: | www.Traders.com |
| E-mail address: | DPenn@traders.com |
Traders' Resource Links | |
| Charting the Stock Market: The Wyckoff Method -- Books | |
| Working-Money.com -- Online Trading Services | |
| Traders.com Advantage -- Online Trading Services | |
| Technical Analysis of Stocks & Commodities -- Publications and Newsletters | |
| Working Money, at Working-Money.com -- Publications and Newsletters | |
| Traders.com Advantage -- Publications and Newsletters | |
| Professional Traders Starter Kit -- Software | |
Click here for more information about our publications!
Comments
Date: 05/05/05Rank: 3Comment:
Date: 05/07/05Rank: 5Comment: David, how do we calculate: The moving average convergence/divergence histogram (MACDH) suggests a potential entry just a little lower in the $42.42 area.

Request Information From Our Sponsors
- StockCharts.com, Inc.
- Candle Patterns
- Candlestick Charting Explained
- Intermarket Technical Analysis
- John Murphy on Chart Analysis
- John Murphy's Chart Pattern Recognition
- John Murphy's Market Message
- MurphyExplainsMarketAnalysis-Intermarket Analysis
- MurphyExplainsMarketAnalysis-Visual Analysis
- StockCharts.com
- Technical Analysis of the Financial Markets
- The Visual Investor
- VectorVest, Inc.
- Executive Premier Workshop
- One-Day Options Course
- OptionsPro
- Retirement Income Workshop
- Sure-Fire Trading Systems (VectorVest, Inc.)
- Trading as a Business Workshop
- VectorVest 7 EOD
- VectorVest 7 RealTime/IntraDay
- VectorVest AutoTester
- VectorVest Educational Services
- VectorVest OnLine
- VectorVest Options Analyzer
- VectorVest ProGraphics v6.0
- VectorVest ProTrader 7
- VectorVest RealTime Derby Tool
- VectorVest Simulator
- VectorVest Variator
- VectorVest Watchdog
