HOT TOPICS LIST
- MACD
- Fibonacci
- RSI
- Gann
- ADXR
- Stochastics
- Volume
- Triangles
- Futures
- Cycles
- Volatility
- ZIGZAG
- MESA
- Retracement
- Aroon
INDICATORS LIST
LIST OF TOPICS
PRINT THIS ARTICLE
by Arthur Hill
Apple has consolidated over the last two weeks and is likely to make a significant move sooner rather than later.
Position: Hold
Arthur Hill
Arthur Hill is currently editor of TDTrader.com, a website specializing in trading strategies, sector/industry specific breadth stats and overall technical analysis. He passed the Society of Technical Analysts (STA London) diploma exam with distinction is a Certified Financial Technician (CFTe). Prior to TD Trader, he was the Chief Technical Analyst for Stockcharts.com and the main contributor to the ChartSchool.
PRINT THIS ARTICLE
FLAGS AND PENNANTS
Apple Settles After Support Break
05/05/05 02:08:00 PMby Arthur Hill
Apple has consolidated over the last two weeks and is likely to make a significant move sooner rather than later.
Position: Hold
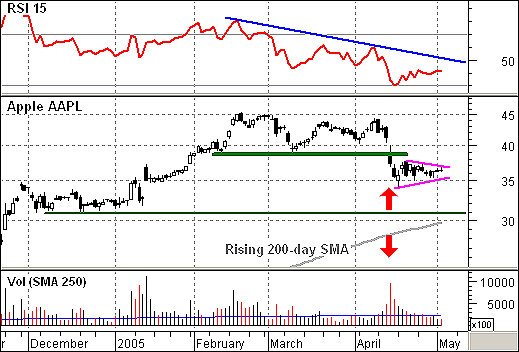
| After meeting resistance around 45, the stock broke below its March low with a gap-laden decline on high volume (red arrows). Up until this time, the stock had held up relatively well in 2005, but finally succumbed to overall pressure in tech stocks. A pennant consolidation formed over the last two weeks, and the resolution of this pattern holds the key. |
| The pennant is typically a continuation pattern and the prior decline gives this pattern a bearish bias. As such, a move below 35 would signal a continuation lower and the downside target would be support around 30. This support area is confirmed by the 200-day simple moving average (SMA) and the December lows. See Figure 1. |

|
| Figure 1: Apple. The potential is there for an upside breakout. |
| Graphic provided by: MetaStock. |
| Graphic provided by: Reuters Data. |
| |
| Even though the pennant carries a bearish bias, I would still be on the lookout for a potential upside breakout. First, the 200-day SMA is rising and the long-term trend is clearly up. Second, the relative strength index (RSI) reached oversold levels in mid-April and bounced over the last two weeks. A move above the pennant high ($37.74) would put the bulls back in play. For confirmation, I would look for RSI to break above 50 and volume to expand. |
Arthur Hill is currently editor of TDTrader.com, a website specializing in trading strategies, sector/industry specific breadth stats and overall technical analysis. He passed the Society of Technical Analysts (STA London) diploma exam with distinction is a Certified Financial Technician (CFTe). Prior to TD Trader, he was the Chief Technical Analyst for Stockcharts.com and the main contributor to the ChartSchool.
| Title: | Editor |
| Company: | TDTrader.com |
| Address: | Willem Geetsstraat 17 |
| Mechelen, B2800 | |
| Phone # for sales: | 3215345465 |
| Website: | www.tdtrader.com |
| E-mail address: | arthurh@tdtrader.com |
Traders' Resource Links | |
| TDTrader.com has not added any product or service information to TRADERS' RESOURCE. | |
Click here for more information about our publications!
Comments
Date: 05/05/05Rank: 4Comment:
Date: 05/08/05Rank: 5Comment: Very efficient presentation of concise conceptual analysis on entry.

Request Information From Our Sponsors
- StockCharts.com, Inc.
- Candle Patterns
- Candlestick Charting Explained
- Intermarket Technical Analysis
- John Murphy on Chart Analysis
- John Murphy's Chart Pattern Recognition
- John Murphy's Market Message
- MurphyExplainsMarketAnalysis-Intermarket Analysis
- MurphyExplainsMarketAnalysis-Visual Analysis
- StockCharts.com
- Technical Analysis of the Financial Markets
- The Visual Investor
- VectorVest, Inc.
- Executive Premier Workshop
- One-Day Options Course
- OptionsPro
- Retirement Income Workshop
- Sure-Fire Trading Systems (VectorVest, Inc.)
- Trading as a Business Workshop
- VectorVest 7 EOD
- VectorVest 7 RealTime/IntraDay
- VectorVest AutoTester
- VectorVest Educational Services
- VectorVest OnLine
- VectorVest Options Analyzer
- VectorVest ProGraphics v6.0
- VectorVest ProTrader 7
- VectorVest RealTime Derby Tool
- VectorVest Simulator
- VectorVest Variator
- VectorVest Watchdog
