HOT TOPICS LIST
- MACD
- Fibonacci
- RSI
- Gann
- ADXR
- Stochastics
- Volume
- Triangles
- Futures
- Cycles
- Volatility
- ZIGZAG
- MESA
- Retracement
- Aroon
INDICATORS LIST
LIST OF TOPICS
PRINT THIS ARTICLE
by Arthur Hill
A recent breakout on good volume bodes well for Intel as long as key support holds.
Position: Accumulate
Arthur Hill
Arthur Hill is currently editor of TDTrader.com, a website specializing in trading strategies, sector/industry specific breadth stats and overall technical analysis. He passed the Society of Technical Analysts (STA London) diploma exam with distinction is a Certified Financial Technician (CFTe). Prior to TD Trader, he was the Chief Technical Analyst for Stockcharts.com and the main contributor to the ChartSchool.
PRINT THIS ARTICLE
MOVING AVERAGES
Time For Intel To Hold Or Fold
05/04/05 02:29:56 PMby Arthur Hill
A recent breakout on good volume bodes well for Intel as long as key support holds.
Position: Accumulate
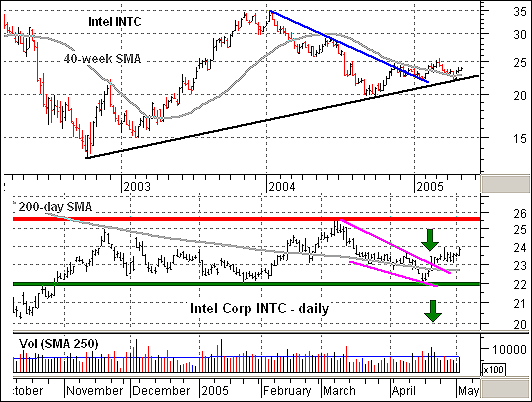
| Starting with the weekly chart for some perspective, we can see that Intel challenged the January 2004 trendline (blue) in November and December, but did not fully break above until February 2005. This breakout coincided with a break above the 40-week simple moving average (SMA), which is equivalent to the 200-day SMA (40 x 5 = 200). |
| With the trendline (black) and moving average breaks, the October 2002 trendline now holds the long-term key. A move below 22 would break this trendline and the 40-week SMA to put the bears back in control. |

|
| Figure 1: Intel daily chart. Turning to the daily chart for some details, we can see clear support around 22 for INTC and a falling wedge breakout in late April. The move occurred on good volume (green arrows), and the stock held its gains over the last two weeks. |
| Graphic provided by: MetaStock. |
| Graphic provided by: Reuters Data. |
| |
| Turning to the daily chart for some details (Figure 1), we can see clear support around 22 and a falling wedge breakout in late April. The move occurred on good volume (green arrows), and the stock held its gains over the last two weeks. This reinforces support at 22 and the next test is resistance around 25.5. |
| The stock formed a large trading range between 22 and 25.5 over the last six months. A break above 25.5 would break trading range resistance and call for further gains. This would be most bullish for Intel (INTC), the semiconductor group and the Nasdaq overall. The next stop would then become the resistance zone around 30-35. |
Arthur Hill is currently editor of TDTrader.com, a website specializing in trading strategies, sector/industry specific breadth stats and overall technical analysis. He passed the Society of Technical Analysts (STA London) diploma exam with distinction is a Certified Financial Technician (CFTe). Prior to TD Trader, he was the Chief Technical Analyst for Stockcharts.com and the main contributor to the ChartSchool.
| Title: | Editor |
| Company: | TDTrader.com |
| Address: | Willem Geetsstraat 17 |
| Mechelen, B2800 | |
| Phone # for sales: | 3215345465 |
| Website: | www.tdtrader.com |
| E-mail address: | arthurh@tdtrader.com |
Traders' Resource Links | |
| TDTrader.com has not added any product or service information to TRADERS' RESOURCE. | |
Click here for more information about our publications!
Comments
Date: 05/04/05Rank: 4Comment:

Request Information From Our Sponsors
- StockCharts.com, Inc.
- Candle Patterns
- Candlestick Charting Explained
- Intermarket Technical Analysis
- John Murphy on Chart Analysis
- John Murphy's Chart Pattern Recognition
- John Murphy's Market Message
- MurphyExplainsMarketAnalysis-Intermarket Analysis
- MurphyExplainsMarketAnalysis-Visual Analysis
- StockCharts.com
- Technical Analysis of the Financial Markets
- The Visual Investor
- VectorVest, Inc.
- Executive Premier Workshop
- One-Day Options Course
- OptionsPro
- Retirement Income Workshop
- Sure-Fire Trading Systems (VectorVest, Inc.)
- Trading as a Business Workshop
- VectorVest 7 EOD
- VectorVest 7 RealTime/IntraDay
- VectorVest AutoTester
- VectorVest Educational Services
- VectorVest OnLine
- VectorVest Options Analyzer
- VectorVest ProGraphics v6.0
- VectorVest ProTrader 7
- VectorVest RealTime Derby Tool
- VectorVest Simulator
- VectorVest Variator
- VectorVest Watchdog
