HOT TOPICS LIST
- MACD
- Fibonacci
- RSI
- Gann
- ADXR
- Stochastics
- Volume
- Triangles
- Futures
- Cycles
- Volatility
- ZIGZAG
- MESA
- Retracement
- Aroon
INDICATORS LIST
LIST OF TOPICS
PRINT THIS ARTICLE
by Sean Moore
One of the keys to successful trading stems from being able to time price reversals. Gauging the market's momentum and likelihood to change direction can certainly help you improve your timing and profits. The Williams %R indicator can often be used to help predict these directional changes.
Position: N/A
Sean Moore
Traders.com Staff Writer.
PRINT THIS ARTICLE
WILLIAM'S %R
Overbought or Oversold?
06/29/00 01:28:09 PMby Sean Moore
One of the keys to successful trading stems from being able to time price reversals. Gauging the market's momentum and likelihood to change direction can certainly help you improve your timing and profits. The Williams %R indicator can often be used to help predict these directional changes.
Position: N/A
| The Williams %R indicator is one that will help give an indication of oversold or overbought conditions of a certain market or security. The indicator was developed by Larry Williams, a well-known technical analyst. By identifying oversold and overbought conditions, you are essentially predicting a change in market momentum. The Williams %R indicator can be described as a momentum oscillator. When an oversold condition is present, the market is losing its appeal with the sellers. Buyers will begin to see signs of life again and begin to establish positions. This action will result in an upward reversal, as the buyers begin to outpace the sellers. Conversely, in an overbought condition, buyers will lose interest and sellers will take over, creating a downward reversal. |
| So, how does the Williams %R indicator signal these overbought/oversold conditions? The indicator looks at a range of price data and creates a ratio with the following equation: %R = -100((RH - C) / (RH - RL)), Where C = Today's close, RH = The high of the range RL = The low of the range Typically, the oscillator is plotted on a negative scale so that the graph resembles the daily price graph. ie. Oversold conditions are present at the bottom of the graph and overbought conditions are present towards the top of the graph. With this negative value, the %R can range from 0 to -100. The common approach is to look for oversold conditions when the indicator reads anywhere between -80 and -100 and overbought conditions when the indicator reads between 0 and -20. |

|
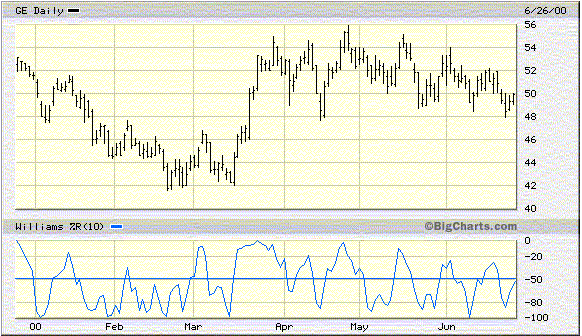
| Figure 1: %R Indicator. Daily price chart for General Electric [GE] plotted with the %R indicator. |
| Graphic provided by: www.bigcharts.c. |
| |
| Figure 1 shows the daily price chart for General Electric [GE] for the last 6 months plotted with the %R indicator. Look for price reversals following times when the %R-value is above -20 or below -80. If the price reversal occurs, then chances are that the momentum has changed. |
| Once the %R-value dips into the oversold or overbought region, it is important to keep a close eye on the price. You will want to wait for the price to change directions before establishing a position. The %R indicator can give you an early warning of this directional change. |
Traders.com Staff Writer.
| Title: | Project Engineer |
| Company: | Technical Analysis, Inc. |
| Address: | 4757 California Ave. SW |
| Seattle, WA 98116 | |
| Phone # for sales: | 206 938 0570 |
| Fax: | 206 938 1307 |
| Website: | Traders.com |
| E-mail address: | smoore@traders.com |
Traders' Resource Links | |
| Charting the Stock Market: The Wyckoff Method -- Books | |
| Working-Money.com -- Online Trading Services | |
| Traders.com Advantage -- Online Trading Services | |
| Technical Analysis of Stocks & Commodities -- Publications and Newsletters | |
| Working Money, at Working-Money.com -- Publications and Newsletters | |
| Traders.com Advantage -- Publications and Newsletters | |
| Professional Traders Starter Kit -- Software | |
Click here for more information about our publications!
Comments
Date: / /Rank: 3Comment:
Date: 03/17/07Rank: 1Comment:

|

Request Information From Our Sponsors
- StockCharts.com, Inc.
- Candle Patterns
- Candlestick Charting Explained
- Intermarket Technical Analysis
- John Murphy on Chart Analysis
- John Murphy's Chart Pattern Recognition
- John Murphy's Market Message
- MurphyExplainsMarketAnalysis-Intermarket Analysis
- MurphyExplainsMarketAnalysis-Visual Analysis
- StockCharts.com
- Technical Analysis of the Financial Markets
- The Visual Investor
- VectorVest, Inc.
- Executive Premier Workshop
- One-Day Options Course
- OptionsPro
- Retirement Income Workshop
- Sure-Fire Trading Systems (VectorVest, Inc.)
- Trading as a Business Workshop
- VectorVest 7 EOD
- VectorVest 7 RealTime/IntraDay
- VectorVest AutoTester
- VectorVest Educational Services
- VectorVest OnLine
- VectorVest Options Analyzer
- VectorVest ProGraphics v6.0
- VectorVest ProTrader 7
- VectorVest RealTime Derby Tool
- VectorVest Simulator
- VectorVest Variator
- VectorVest Watchdog
