HOT TOPICS LIST
- MACD
- Fibonacci
- RSI
- Gann
- ADXR
- Stochastics
- Volume
- Triangles
- Futures
- Cycles
- Volatility
- ZIGZAG
- MESA
- Retracement
- Aroon
INDICATORS LIST
LIST OF TOPICS
PRINT THIS ARTICLE
by Gary Grosschadl
A double bottom is a classic bottom formation, and this is apparent with AXP.
Position: Buy
Gary Grosschadl
Independent Canadian equities trader and technical analyst based in Peterborough
Ontario, Canada.
PRINT THIS ARTICLE
DOUBLE BOTTOMS
American Express Charges Higher
05/04/05 08:34:31 AMby Gary Grosschadl
A double bottom is a classic bottom formation, and this is apparent with AXP.
Position: Buy
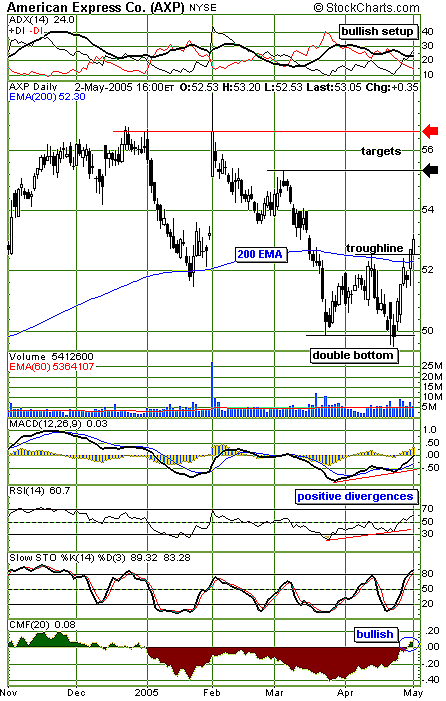
| For a valid double bottom, the troughline must be broken to the upside, and this occurred two trading sessions ago. What makes this more significant is the fact that the ever-important 200-day moving average was also cracked at the same time, in essence acting as a natural troughline. This provides a measured move to the first target at ~55.20 (being the distance of the bottom to the troughline, applied above the troughline). This coincides with a previous shooting star candlestick. With extra juice, this move could also reach 56.80 being close to the previous high. |
| Technical traders should observe that two positive divergences aptly foretold that a double-bottom attempt was in the making. The moving average convergence/divergence (MACD) and the relative strength index (RSI) both show a higher high, while the stock price actually tested lower (Figure 1). |

|
| Figure 1: AXP. American Express puts in a double-bottom formation on this daily chart. |
| Graphic provided by: StockCharts.com. |
| |
| Two other indicators are also showing bullish promise. The directional movement indicator at the top of the chart shows a bullish setup, with the directional indicators +DI above -DI while ADX is above 20. The ideal configuration would be an ADX upslope above 25, and this may soon transpire. Also noteworthy is the Chaikin money flow indicator showing a move to bullish territory. This indicator of supply and demand shows buying pressure building. The stochastics, however, shows some healthy concern with a move to overbought territory above the 80 level. Although this indicator can sometimes stay above this level for extended periods, a turn below 80 can signal a pause or coming downturn. |
| Should the stock decide to consolidate these recent gains, traders should look to a support test of the 200-day exponential moving average (EMA). A close under the 200-day EMA could be a sign of a false breakout. Note the breakout volume is a litle thin, so this could be a possibility. Watch the stock's reaction to the 200-day EMA as a guide going ahead. Strength above this level can lead to those higher targets, former congestion at $54 being a lesser target. |
Independent Canadian equities trader and technical analyst based in Peterborough
Ontario, Canada.
| Website: | www.whatsonsale.ca/financial.html |
| E-mail address: | gwg7@sympatico.ca |
Click here for more information about our publications!
Comments
Date: 05/04/05Rank: 5Comment:

Request Information From Our Sponsors
- StockCharts.com, Inc.
- Candle Patterns
- Candlestick Charting Explained
- Intermarket Technical Analysis
- John Murphy on Chart Analysis
- John Murphy's Chart Pattern Recognition
- John Murphy's Market Message
- MurphyExplainsMarketAnalysis-Intermarket Analysis
- MurphyExplainsMarketAnalysis-Visual Analysis
- StockCharts.com
- Technical Analysis of the Financial Markets
- The Visual Investor
- VectorVest, Inc.
- Executive Premier Workshop
- One-Day Options Course
- OptionsPro
- Retirement Income Workshop
- Sure-Fire Trading Systems (VectorVest, Inc.)
- Trading as a Business Workshop
- VectorVest 7 EOD
- VectorVest 7 RealTime/IntraDay
- VectorVest AutoTester
- VectorVest Educational Services
- VectorVest OnLine
- VectorVest Options Analyzer
- VectorVest ProGraphics v6.0
- VectorVest ProTrader 7
- VectorVest RealTime Derby Tool
- VectorVest Simulator
- VectorVest Variator
- VectorVest Watchdog
