HOT TOPICS LIST
- MACD
- Fibonacci
- RSI
- Gann
- ADXR
- Stochastics
- Volume
- Triangles
- Futures
- Cycles
- Volatility
- ZIGZAG
- MESA
- Retracement
- Aroon
INDICATORS LIST
LIST OF TOPICS
PRINT THIS ARTICLE
by David Penn
A 2B test of bottom and a positive stochastic divergence suggest near-term upside in the $SOX.
Position: N/A
David Penn
Technical Writer for Technical Analysis of STOCKS & COMMODITIES magazine, Working-Money.com, and Traders.com Advantage.
PRINT THIS ARTICLE
REVERSAL
Strength In Semiconductors?
05/04/05 02:19:55 PMby David Penn
A 2B test of bottom and a positive stochastic divergence suggest near-term upside in the $SOX.
Position: N/A
| They don't call it the "slope of hope" for nothing! I was reading somewhere recently that you know that you're in a bear market when everybody is losing money and nobody seems to care. Maybe that defines the nervous action in technology stocks--especially semiconductors--in 2005. After all, if the broader market is truly in trouble, then technology and semiconductor stocks are likely to suffer a disproportionate amount of the pain. Chalk one up for avoiding such stocks like the plague. |
| On the other hand, semiconductor stocks in particular topped out in January 2004--meaning they've already been in a bear market for more than a year. Falling from above the 550 level back in early 2004, the $SOX fell below 350 in the late summer/early autumn of 2004 when positive divergences there helped anticipate the broad-based rally that sent the market higher throughout the balance of 2004 into the earliest days of 2005. This only underscores the notion that if the market is poised to establish a bottom, even a temporary, tradable bounce, semiconductors would tend to be one of the best places to be. Chalk one up for buying semiconductor stocks at "sale" prices. |

|
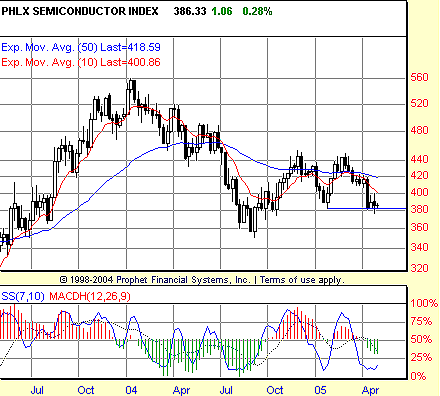
| Figure 1: PHLX. This weekly chart of the Philadelphia semiconductor index shows both the positive divergences between the January and April lows (also apparent on daily charts of the $SOX), as well as the 2B test of bottom. |
| Graphic provided by: Prophet Financial, Inc. |
| |
| So where does this leave prospective semiconductor speculators? It is true enough that the $SOX appears to be developing a positive stochastic divergence between the lower lows in January and April in price, and the higher lows in the corresponding 7,10 stochastic. However, if the $SOX were truly forming a bottom of some permanence, then it would have been preferable for the August bottom to have developed the positive divergence. Arriving when and where it does, the January/April divergence does build a case for a near-term bounce in semiconductor stocks. But that case is not as compelling as it would have been had the divergence occurred at the more pronounced bottom in the summer of 2004. (Interestingly, there was no positive divergence at the August 2004 lows on the daily chart of $SOX, either.) |
| But focusing on the near term, it appears as if there is--at a minimum--a reason for semiconductor bears to feel less giddy and more cautious. Again, looking at the weekly chart (Figure 1), the $SOX established a lower low during the week of April 29 (lower relative to the previous weekly low during the week of April 15). But that lower low on April 29 has yet to show follow-through to the downside. Except for that intraweek penetration to cause the lower low, the 380 level has remained supportive. These are the signs of a potential 2B test of bottom, which would require a reversal back above the level of the previous low (to be more accurate, above the high of the previous low bar) in order to be confirmed. In this case--basis the weekly chart--confirmation would require a move in the $SOX over 406-407. |
| The daily charts offer a lower confirmation point, even as they feature the same positive divergence and 2B test of bottom setup. In the daily chart of the $SOX, a move above 396 would put the 2B test of bottom in good stead. |
Technical Writer for Technical Analysis of STOCKS & COMMODITIES magazine, Working-Money.com, and Traders.com Advantage.
| Title: | Technical Writer |
| Company: | Technical Analysis, Inc. |
| Address: | 4757 California Avenue SW |
| Seattle, WA 98116 | |
| Phone # for sales: | 206 938 0570 |
| Fax: | 206 938 1307 |
| Website: | www.Traders.com |
| E-mail address: | DPenn@traders.com |
Traders' Resource Links | |
| Charting the Stock Market: The Wyckoff Method -- Books | |
| Working-Money.com -- Online Trading Services | |
| Traders.com Advantage -- Online Trading Services | |
| Technical Analysis of Stocks & Commodities -- Publications and Newsletters | |
| Working Money, at Working-Money.com -- Publications and Newsletters | |
| Traders.com Advantage -- Publications and Newsletters | |
| Professional Traders Starter Kit -- Software | |
Click here for more information about our publications!
Comments
Date: 05/04/05Rank: 3Comment:

|

Request Information From Our Sponsors
- StockCharts.com, Inc.
- Candle Patterns
- Candlestick Charting Explained
- Intermarket Technical Analysis
- John Murphy on Chart Analysis
- John Murphy's Chart Pattern Recognition
- John Murphy's Market Message
- MurphyExplainsMarketAnalysis-Intermarket Analysis
- MurphyExplainsMarketAnalysis-Visual Analysis
- StockCharts.com
- Technical Analysis of the Financial Markets
- The Visual Investor
- VectorVest, Inc.
- Executive Premier Workshop
- One-Day Options Course
- OptionsPro
- Retirement Income Workshop
- Sure-Fire Trading Systems (VectorVest, Inc.)
- Trading as a Business Workshop
- VectorVest 7 EOD
- VectorVest 7 RealTime/IntraDay
- VectorVest AutoTester
- VectorVest Educational Services
- VectorVest OnLine
- VectorVest Options Analyzer
- VectorVest ProGraphics v6.0
- VectorVest ProTrader 7
- VectorVest RealTime Derby Tool
- VectorVest Simulator
- VectorVest Variator
- VectorVest Watchdog
